Housing, consumption, and climate

In this edition
- Importance of housing to cooling consumption
- Will rising rates dampen home prices? History is mixed
- Indirect climate risk: the elephant hiding in the SEC's proposed climate disclosure rule
- How to explain declining consumer confidence while wage growth rises?
- Separating emissions from buildings and transportation creates false understanding of real estate's footprint
- Skyrocketing price of natural gas will hit hard for US household finances
- Home prices in China go negative
Importance of housing to cooling consumption
A huge fraction of wealth is owned by the richest 10% of households, but close to 80% of consumption is driven by the rest. Housing prices will be a key focal point for the Fed as it aims to cool that consumption.
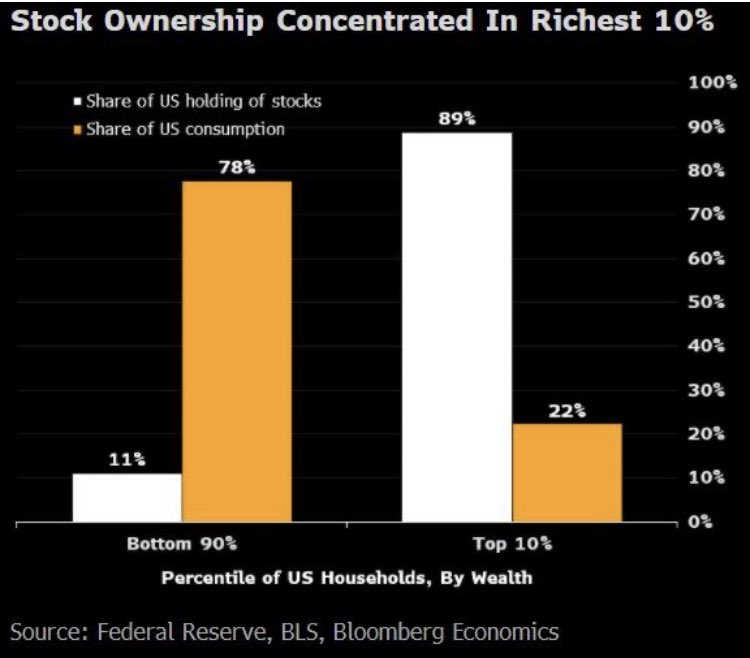
Anyone reading the news knows that equities are down significantly YTD. But that won't do it for consumption. Yes there's a wealth effect linking equity price levels and consumption, but to affect total consumption equities don't meet muster because they are concentrated in the hands of too few households that spend too little overall.
Housing is where the real action is. About two-thirds of total wealth of the median US household is in home equity. And past research has shown that not only is there a wealth effect linking housing prices to consumption, but the wealth effect is stronger for housing than for other asset classes, like equities.
In the past few days, we've seen early signs of cooling in the housing market, but only in activity, not prices. Just two days ago, we learned that new home sales dropped to their lowest level in a few years... but prices are still on the rise. And perhaps unsurprisingly, despite low consumer confidence, consumption remains robust, which means inflation has no chance of slowing down, which reinforces all likelihood of deeper rate hikes in the coming months.

Some unemployment is inevitable as the rate hikes sink in, but how much depends on how responsive housing prices are to the Fed's actions. Mortgage rates are up and sales are down, but prices aren't yet responding. It's possible they won't respond given the generalized lack of supply. If that happens, the labor market seems set for more pain.
Will rising rates dampen home prices? History is mixed
Can we expect home prices to decline or even stay flat in real terms as rates rise? This piece from First American's Mark Fleming shows that, in most past periods of rising rates, home prices have continued to rise in real terms.
Real home prices increased 32.5% from March 2021 - March 2022. That's partly why we're in inflation crisis mode, which has led the Fed to respond with rising rates. Given the known wealth effect linking home prices and household consumption, it's important to try to cool the housing market.
But this research from First American shows how hard that will be. Fleming compares nine rising rate periods over the last three decades. We see that real price decline is almost never seen. It's common for home prices to continue to outpace overall inflation, though the rate at which they do varies considerably as we see in the graph.

This definitely doesn't mean this approach is hopeless. Slowing real home price growth from 32.5% y-o-y to something like the current (Feb-March 2022) 6.7% will already help. But it does point to how uncertain this mechanism is, in part because home prices are driven by many things, and in part because housing supply problems are so bad right now that rabid demand will almost certainly continue to drive nominal home price growth at a rate higher than overall CPI growth.
That supply problem is what needs to be tackled in order to bring shelter inflation down to more reasonable levels in structural terms. Any slowdown in housing demand achieved as a result of Fed measures today won't last longer than the measures and any catch-up in supply chain challenges. To tackle to structural challenge of home price growth outpacing overall price growth, we need supply side solutions.
Indirect climate risk: the elephant hiding in the SEC's proposed climate disclosure rule
As public companies scramble to prepare for the likely adoption of the SEC's new rules on climate disclosure, most companies are ignoring the biggest challenge – assessing major climate-related risks to business model and activities.
A lot of the industry debate and public reaction to the SEC's proposal has to do with data collection. The proposed rule will mandate publicly traded companies to collect and expose direct physical risk data (e.g., a site's direct exposure to flood/storm/etc) and data related to greenhouse gas emissions. A chunk of the debate has focused on Scope 3 emissions – how can companies be expected to do this?; what should they include?; what does 'materiality' really cover?; and so on. But at its root this part of the discussion is also about data collection. And not without some justification. A good part of the proposal focuses itself on data collection.
But what's been lost in the debate is what the proposed rule mandates on risk analysis. Companies will be required to systematically assess climate-related risks to their business model, operations, likelihood of litigation, etc. Yes, companies should all be doing this already for any major risk, climate-related or not. But that's also true of tracking and exposing data related to issues of all issues of material significance to (potential) investors... and yet they don't. Hence the proposal's explicit call out that companies need to engage in systematic risk analysis when it comes to climate-related risk.
Ok fine, but how is the lack of discussion of this part a problem? It all comes down to the data and understanding companies will need in order to do this well. Coles notes: they will need to go well beyond direct physical risks and their immediate emissions to understand the biggest risks and opportunities for the business. And that means dramatically raising the bar on understanding how climate change will alter the economy and society.

Yes, if your property is directly in a flood zone, that's a clear risk. But many properties and companies that are not exposed to direct physical risk are still exposed to huge climate-related risks that could present important business challenges. Take for example an office tower that itself is not exposed to any direct physical risk but that relies on a transit network that is exposed to important physical risks. That office tower clearly faces important indirect physical risk that threatens the valuation and utility of the asset. Or take the example of a company with operations in a country that purchases most of its core food imports from a region of the world facing high and rising drought risks. Simply knowing that the company's factory or warehouse is not itself exposed to drought risk doesn't tell you much about whether the company's workforce is highly exposed to drought risk through their dependency on a drought-prone area. Or take the example of a real estate company that has a number of assets in a region where employment is predominantly in a sector that faces increasingly stringent climate-related regulation, like oil and gas. Again, the real estate company itself might not have assets exposed to direct physical risk or emitting high amounts of emissions, but that doesn't change its high exposure to climate-related risk.
Of course, climate-related changes don't only create risks... they also create huge opportunities that companies will want to take advantage of and expose to investors in order to shore up their valuation. For example, agricultural lands in some regions will see rising productivity even as others see the opposite. Real estate companies that are ahead of the game in terms of greening their portfolio will benefit enormously from rising tenant demand for green and wellness-oriented buildings, while those with older, brown buildings will see the brown discount cut more deeply.
Data collection is a needed advance, but it won't come anywhere close to solving this risk analysis and strategy challenge. For a lot of organizations, this will be much harder to adapt to than the data collection piece.
How to explain declining consumer confidence while wage growth rises?
A lot of analysts are puzzled by the simultaneous decline in consumer confidence, on the one hand, and rising wages, on the other hand. Two things help explain this phenomenon: 1) declining real wages, and 2) declining household wealth due largely to the sell-off in equities.
As the chart here shows, most employee groups have seen real wage stagnation over the past year and a half.

Not shown, but equally important is the hit the equities market has taken. YTD the S&P 500 is down almost 18%. That's important for a lot of households because equities, mutual funds, etc as a portion of household wealth has increased substantially in recent years -- to a 70-year high. Of course, the wealthiest households hold a disproportionate fraction of these equities, but holdings have risen pretty much across the board, with the exception of the poorest.
That means household wealth -- paper though this portion is -- has taken a considerable hit. JP Morgan estimated recently that households have lost somewhere between $5-8 trillion in 2022 as a result of the bucking market. There's still gas left in the tank given the savings build-up over the pandemic years, but that's a substantial write-down. And that manifests itself in consumer confidence.
Separating emissions from buildings and transportation creates false understanding of real estate's footprint
Check out this report by JLL comparing distribution of emissions across buildings, transport, industry, etc in cities around the world.
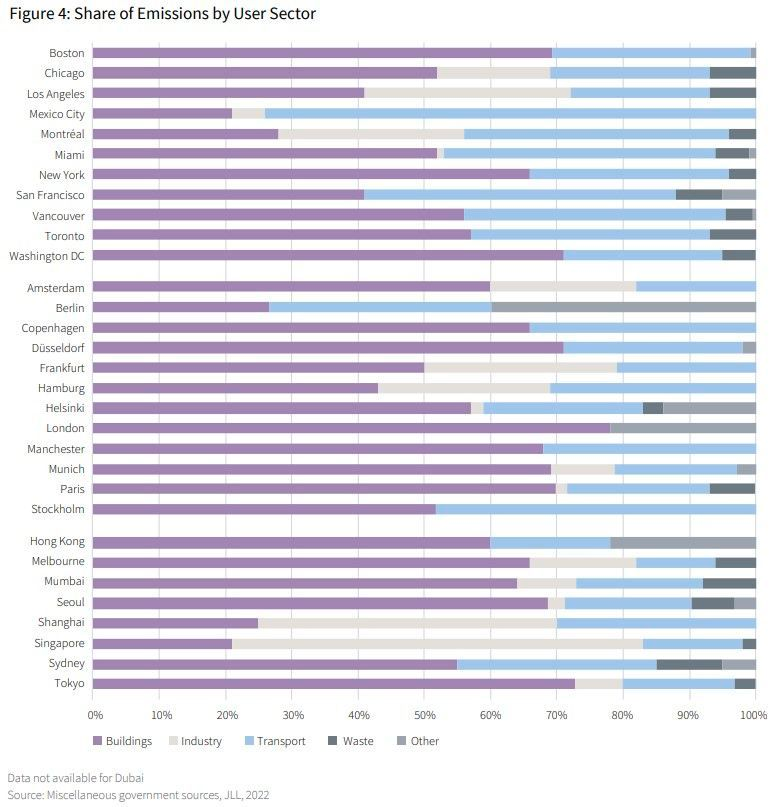
One thing I take issue with here is the separation between buildings and transportation. On the one hand, it's a helpful heuristic for understanding the breakdown of emissions. On the other hand, it perpetuates the dominant but misleading notion that real estate's impact on the world is all about the composition of the envelope and what happens inside the envelope, without also recognizing that some of the biggest impacts that real estate has on the world have to do with site selection and site programming.
A building or home can be extremely operationally efficient and built with the greenest of building materials and still be terribly unsustainable if it's built in a location that requires massive and regular travel by gas-powered vehicles. Right now, the real estate sector talks only about building with greener materials and reducing energy consumption, but ignores the emissions impact of site selection and site programming.
A shopping mall built far from public transit will rely on thousands of car trips a day to keep it afloat. It's written straight into the business model. Does anyone doubt this when the developers decide to dedicate so much space to parking lots? If that same space is converted into a mixed use development with residential, office, and retail, mobility patterns will change in ways that rely less on car trips.
The more we continue to talk about the real estate's emissions footprint as the same thing as the footprint of buildings, the more we obfuscate this crucial link between the built environment and transportation. We need to change the discussion and the reporting framework to make it compulsory for real estate companies and those who occupy real estate to measure and reduce their transportation-related emissions. It's clearly in their capacity to do so.
Skyrocketing price of natural gas will hit hard for US household finances
The price of natural gas in the US is through the roof. This is especially surprising given that Spring is usually when prices come down given the typical drop in demand as temperatures hit the goldilocks zone between winter and summer.

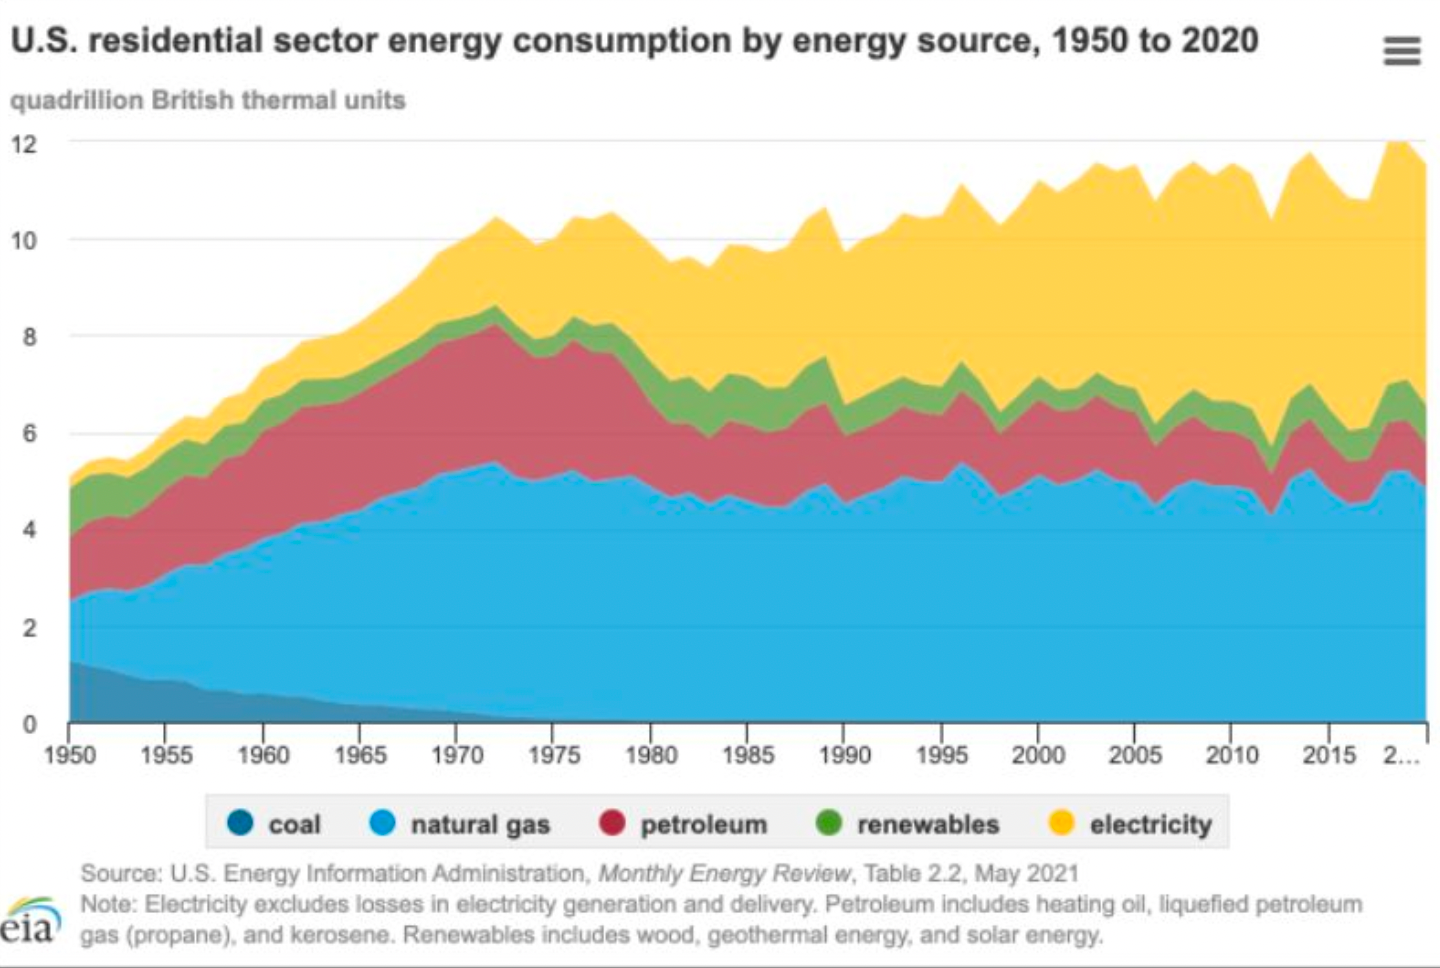
The graph above shows spot price for US natural gas. The spike is significant for household finances as close to half of US households use natural gas for home energy. And natural gas was the source of almost one quarter of the residential sector's total energy consumption. See here for more household energy use data.
Beyond household direct use of natural gas, it's a huge source of energy for utilities' production of electricity. Natural gas accounted for 40% of total utility-scale US electricity generation by all sectors in 2020.
Take together, this will put further pressure on households' ability to pay rent and mortgage. As the graph below shows, natural gas and electricity together account for about 90% of household energy use in the US today.
Home prices in China go negative
In North America, it's easy to forget that home prices can turn negative. China is a good reminder. Prices just went negative again.
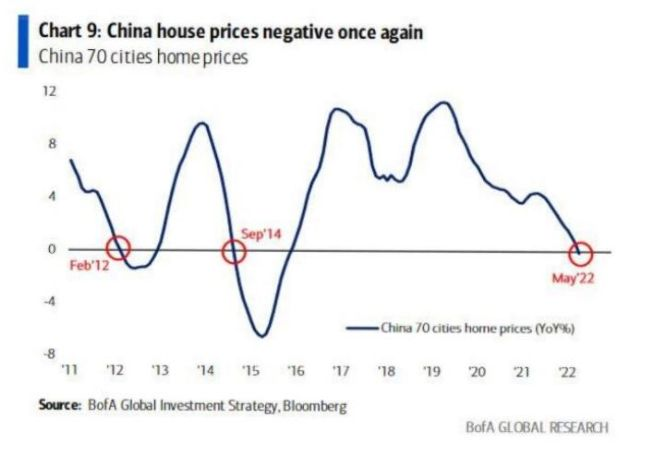
Real estate is the world's largest asset class, and China's real estate market is the largest of them all, larger even than the US's equities market.
China's housing market is teetering on the brink right now. A few big developers have already defaulted in recent months. If the property sector goes belly up, the country's economy goes with it -- it's currently about 25% of the country's GDP. And with that things would turn very ugly for the global economy given that Chinese growth has been a huge fraction of global growth in recent times.
Props to Alfonso Peccatiello for posting this graph earlier on Twitter.