Crisis and disruption in natural gas, food prices, and migration: What impact on US housing?

In this edition
- Rapid convergence in US and European natural gas markets shifts the sands of affordability and jobs
- Crisis and divergence spur Mexico-US migration, adding fuel to the hot housing market
Rapid convergence in US and European natural gas markets shifts the sands of affordability and jobs
Last week, an explosion and fire at one of the US's largest liquified natural gas (LNG) export terminals caused a sudden divergence of prices for the commodity on either side of the Atlantic. European wholesale prices have surged more than 57%, while those in the US have fallen by over 20%. That divergence is a momentary disruption to a much larger trend of increasing convergence in the two markets. In the US, some regions stand to benefit from that reordering, while others stand to lose. All of this could add up to a geographic shake-up with important consequences for real estate actors.
To understand the dynamics at play, we need a quick review of the history of natural gas in the US and Europe over the last few decades. As I wrote several weeks ago, natural gas prices in the US have been on a tear upwards. That trend started at the onset of the pandemic, but has accelerated since the start of the Russia-Ukraine war. On the day before the US terminal fire, the US price was near near a 14-year high (excluding a a blip of a few days at the very beginning of the pandemic).
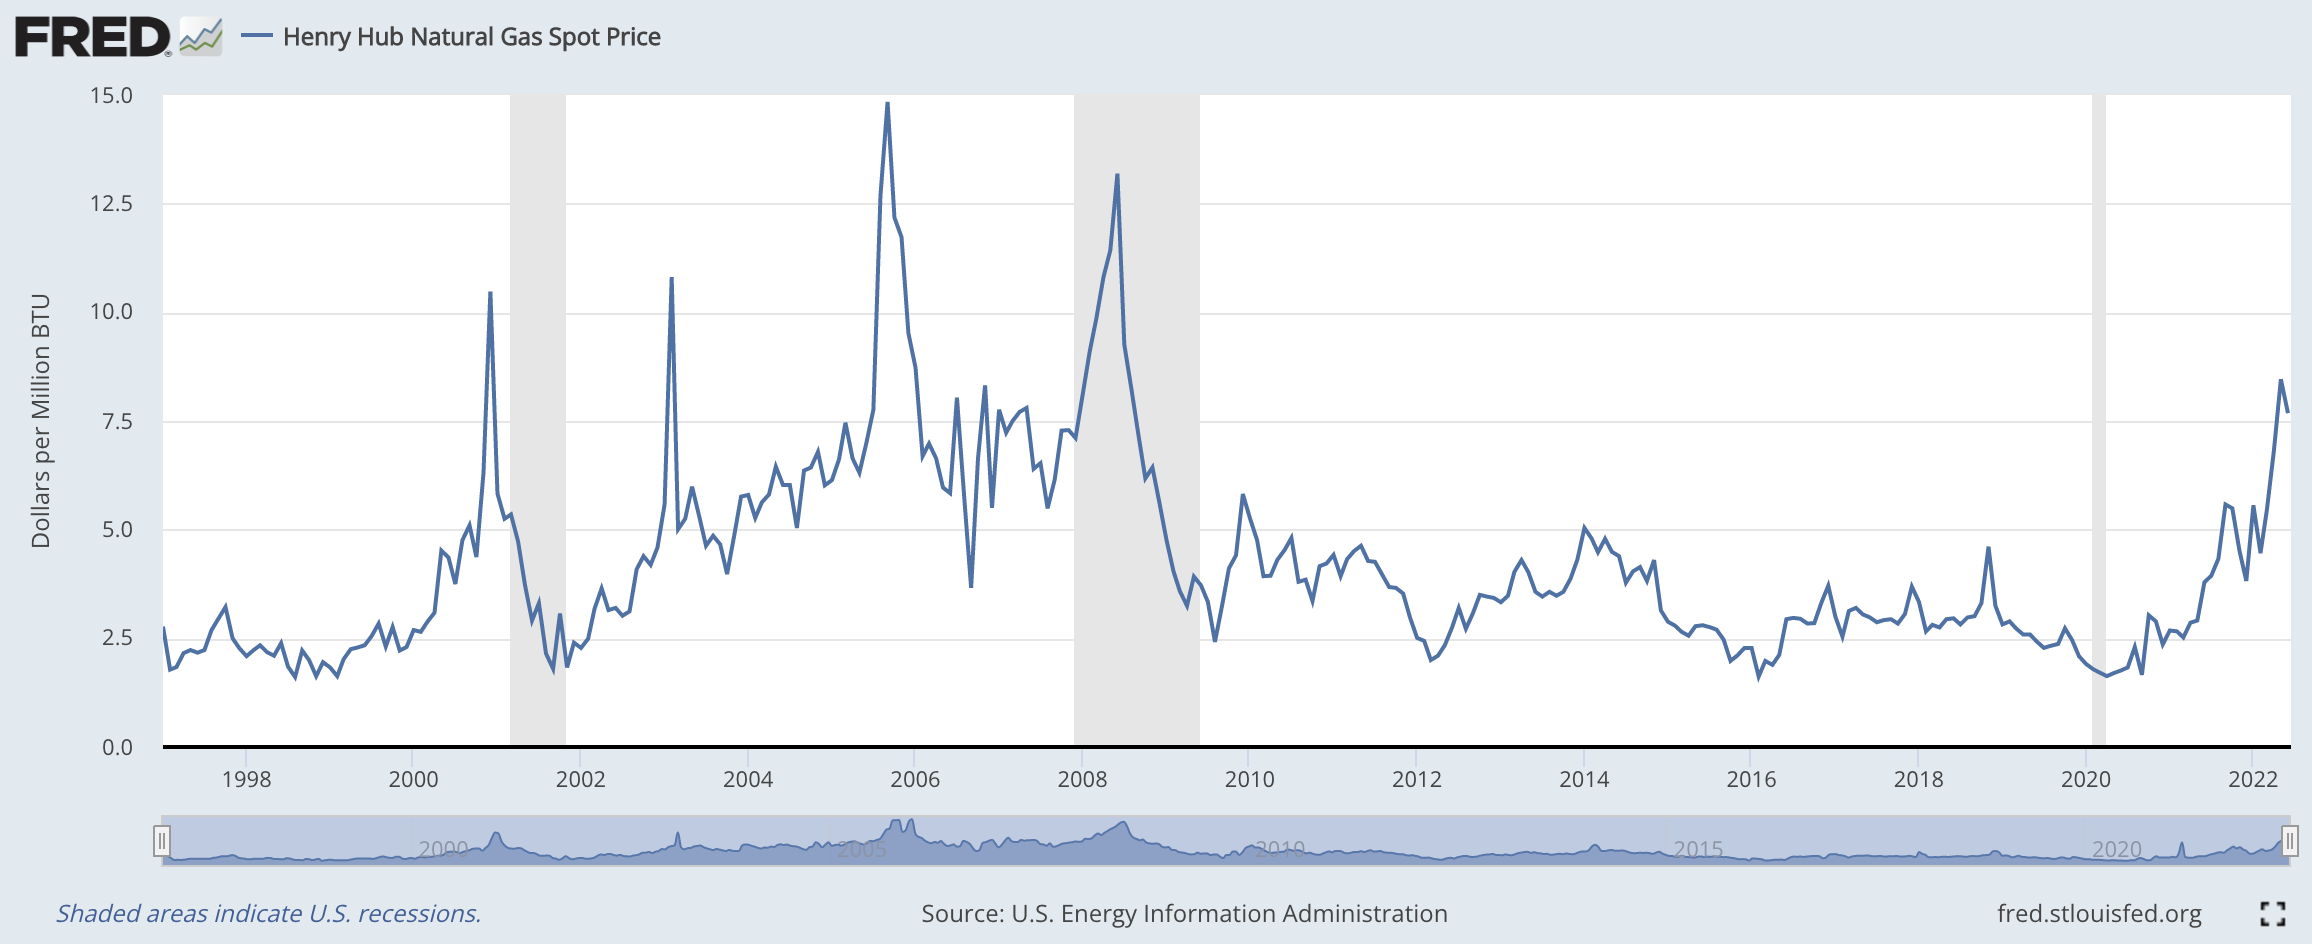
Prior to the big uptick over the last two years, prices in the US were near all-time lows for over a decade. This was partly driven by a massive increase in domestic supply coming from the shale boom – the deployment of hydraulic fracking and horizontal drilling methods to extract gas (and crude oil) in cheaper and more effective ways.
The result was an American market flush with cheap natural gas. Unsurprisingly, that triggered an increase in domestic use of the fuel. One major shift that occurred was a much larger use of natural gas for electricity generation. Utilities invested massively to decrease their reliance on coal, replacing it with natural gas and, to a lesser extent, renewables (graph below).
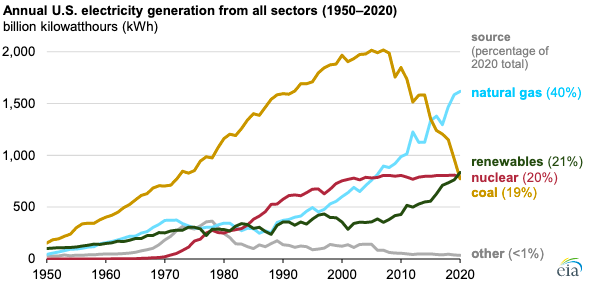
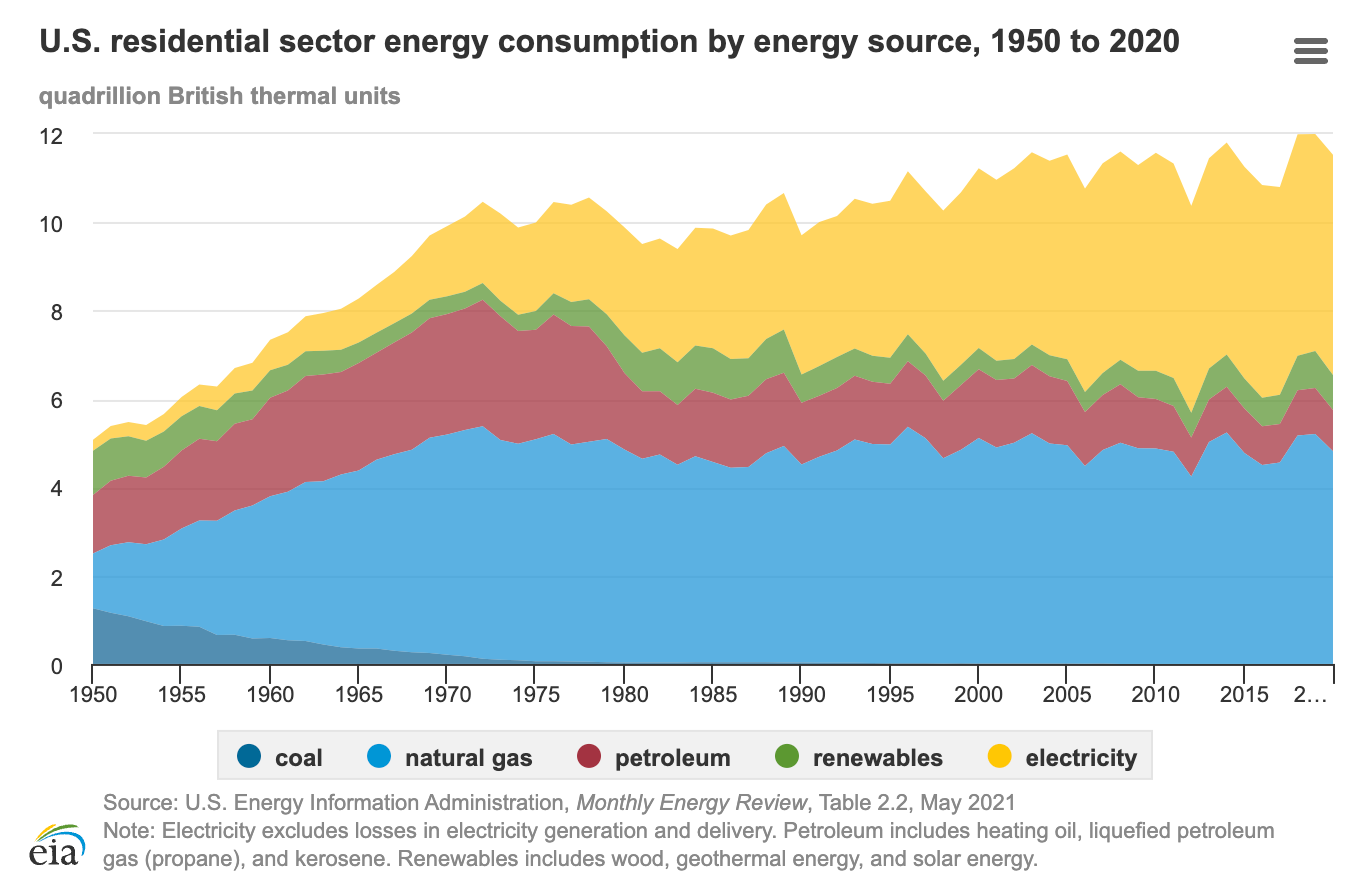
That shift to natural gas in electricity generation has meant that American households have become much more reliant on the fuel over time. As the graph below shows, direct use of natural gas (e.g., for home heating, gas cooking) accounts for roughly 40% of households' total energy consumption, while indirect use (through electricity generation) accounts for a further 20% (40% of overall electricity production in the US is powered by natural gas). Together, that means that over 60% of residential energy use is powered by natural gas today.
Not all parts of the country took this plunge. The chart below summarizes each state's use of different sources for generating electricity. Eyeballing the chart tells us that close to half of states rely on natural gas for a substantial part of their electricity generation (e.g., Florida 75%, Texas 52.1%, California 47.3%). Regionally, natural gas plays a particularly significant role in electricity generation on the East Coast and throughout the Sunbelt.

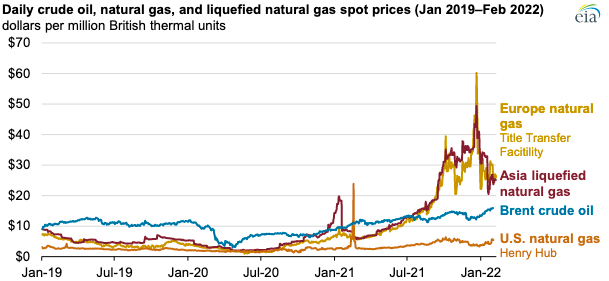
The economics that drove utilities, states, and households to make these shifts made sense while natural gas prices were extremely low. But circumstances changed at the start of the pandemic and have worsened with the Russia-Ukraine war. From late 2020 onwards, natural gas prices in Europe and Asia have risen more than 5x (graph below) and have spiked close to 4x in the US (graph above). Suddenly, many American households and companies face a much higher energy cost structure than they did before the pandemic.
The Russia-Ukraine war has played an outsized role in driving this price increase. In an effort to negate its dependence on Russian energy, the EU recently committed to weaning itself off Russian natural gas by 2030 through a mix of securing natural gas and oil supplies from elsewhere, improving energy efficiency and accelerating the shift to renewables. Today, roughly 40% of the EU's natural gas is supplied by Russia, so any effort to block that supplier promises to dramatically raise near-term prices in Europe and shake up the global market in general.
On March 25, 2022, President Joe Biden announced an agreement that committed the US LNG industry to supply Europe with an additional 15 billion cubic meters (bcm) of LNG before the end of the calendar year, as well as an additional 50 bcm through 2030. That commitment is huge given how little the US exports to the EU today and how big a challenge it is to expand LNG export capacity today.
Those with a keen eye will note in the graph above that the US price still lags considerably behind its European and Asia counterparts. Historically, the economics of exporting LNG to Europe or Asia didn't make much sense because the price differential was never important enough. As a result, little export infrastructure was built in the US. (For its part, Europe faces the mirror image of this challenge in its lack of LNG import infrastructure, especially in countries that have strong pipeline supply connections).
But this is changing at a rapid pace. Companies are scrambling to take advantage of existing export infrastructure given the huge arbitrage opportunity on offer, while others are pushing hard to build new export infrastructure to make possible the huge amounts that Biden has committed to Europe and the profits that stand to be made. Estimates vary for where the longer term price of US natural gas will settle, but many focus on a range around $10, which is higher still than today's $7.68. If that projection holds true, it will represent more than a 3x increase in natural gas prices for US utilities, households, and companies over the price they paid (directly or indirectly) during the shale boom years and, crucially, when a lot of the shift to natural gas electricity generation occurred.
The impact of these trends will be felt differently depending on how a region fits into the natural gas landscape. Above, we saw that states on the East Coast and in the Sunbelt generate a significant part of their electricity using natural gas. Households and companies in those regions will see high and rising electricity, heating, and cooking gas bills.
But some regions also stand to benefit in big ways from these shifts. As the maps below show, gas production in the US is projected to be concentrated in several areas along the East Coast and in the Sunbelt – the same regions that have turned to natural gas for electricity generation over time.
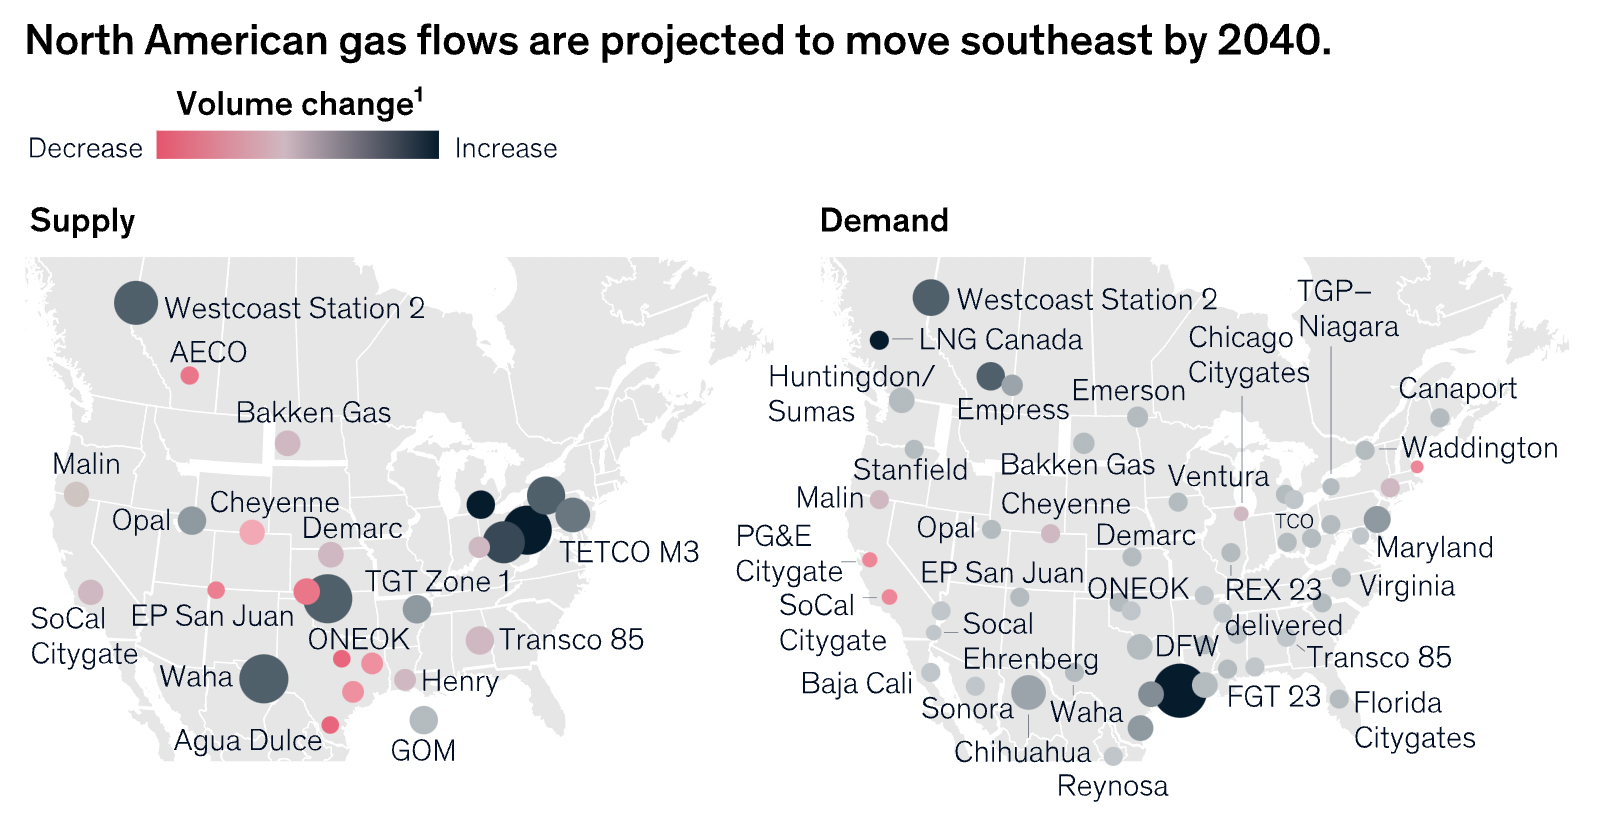
Gas production is one thing; LNG export is another thing. On that latter count, export capacity is particularly concentrated along the Gulf Coast – in Texas and Louisiana (map below).

McKinsey & Company projects that by 2040, flows of natural gas in the US will shift towards the Gulf Coast (map below). This is in response to several forces. First, as we saw above, states along the Gulf Coast and in the Sunbelt in general now use natural gas to power a considerable portion of their electricity generation. Second, LNG export terminals (current and upcoming) are concentrated along the Gulf Coast. Third, as I discuss in the article below, the Sunbelt is seeing net in-migration over time, while the Northeast and California are seeing net out-migration. All of this adds up to increased demand for natural gas – both for direct consumption and for export – along the Gulf Coast and in the Sunbelt broadly.

When we consider the cost implications of rising prices, on the one hand, and the production and job implications of those same rising prices, on the other hand, some regions look likely to win while others look likely to lose. California, the Northeast, and Florida are all regions that now rely considerably on natural gas for energy production but that will see few direct economic benefits from rising production and exports. By contrast, while Texas, Louisiana, and other states along the Gulf Coast have also increased their reliance on natural gas for electricity generation, they also stand to benefit enormously from the boom in production and the activities required for LNG exportation.
That pattern – Sunbelt wins, in particular Texas; California and the Northeast lose – is one that dominates the headlines in housing and the wider real estate market these days. The Sunbelt has experienced several years of in-migration, while California and the Northeast have seen the opposite. One major driver of these patterns has been households' search for more affordable housing and a lower cost of living in the Sunbelt. The patterns we see in the natural gas ecosystem in the US today and going forward look likely to exacerbate this trend.
Crisis and divergence spur Mexico-US migration, adding fuel to the hot housing market
As the global economy teeters on the edge of recession, talk of fragmentation picks up. The effects of diverging fortunes could be big, as safe countries face one reality and riskier countries face another. The US-Mexico border is one area where this threatens to manifest itself. Migration northwards is higher this year than in the recent past, while strains on Mexico's economy and public finances make it likely that the flow of people could grow significantly. That will add demand to an already hot housing market, particularly in gateway cities near the border, where housing and rental price growth has already been particularly strong.
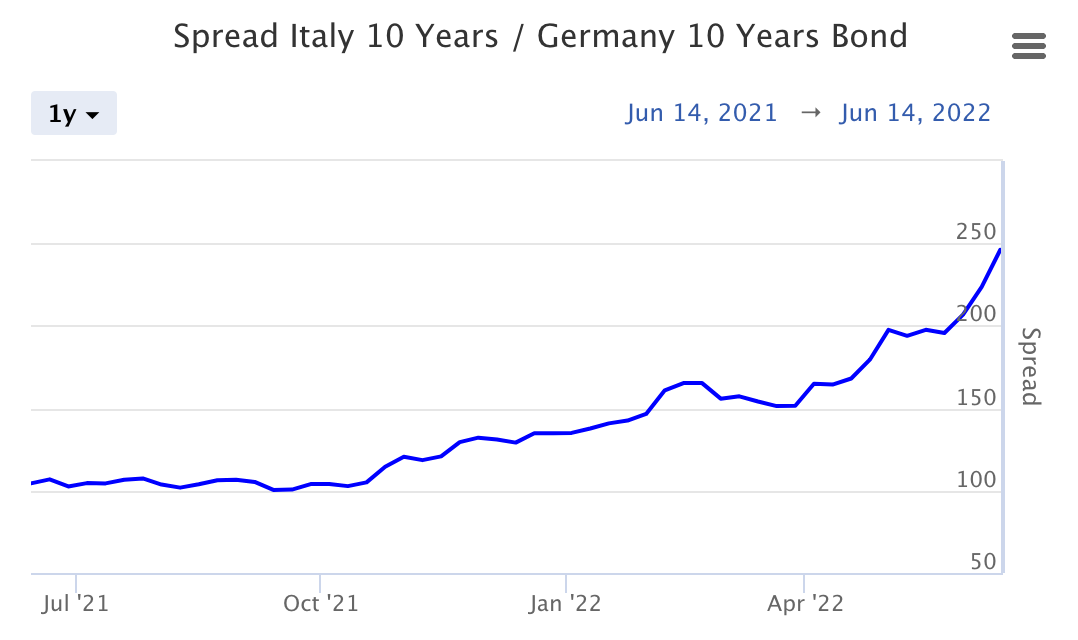
These days, the term 'fragmentation' most often comes up in the context of the European Union (EU), where the fortunes of high- and low-risk countries are diverging in the face of extreme economic uncertainty. The spread between 10-year bond yields for Italy (second highest debt-to-GDP ratio in the EU; highest government deficit of any major Eurozone economy) and Germany (economic stalwart) has grown from roughly 100 bps in late 2021 to over 235 bps today. This spread is a reflection of investor confidence in the two economies. And it has real bite – it costs Italy a lot more to finance its debt than it does for Germany.
Fragmentation and divergence look a bit different in the North American context, where no similar cross-national union and shared monetary policy exists. But the effects could still be large, particularly in the domain of migration.
Mexico's economy is actually faring better than some others in Latin America today. Nominal growth remains positive, while the unemployment rate has declined to a robust 3%.
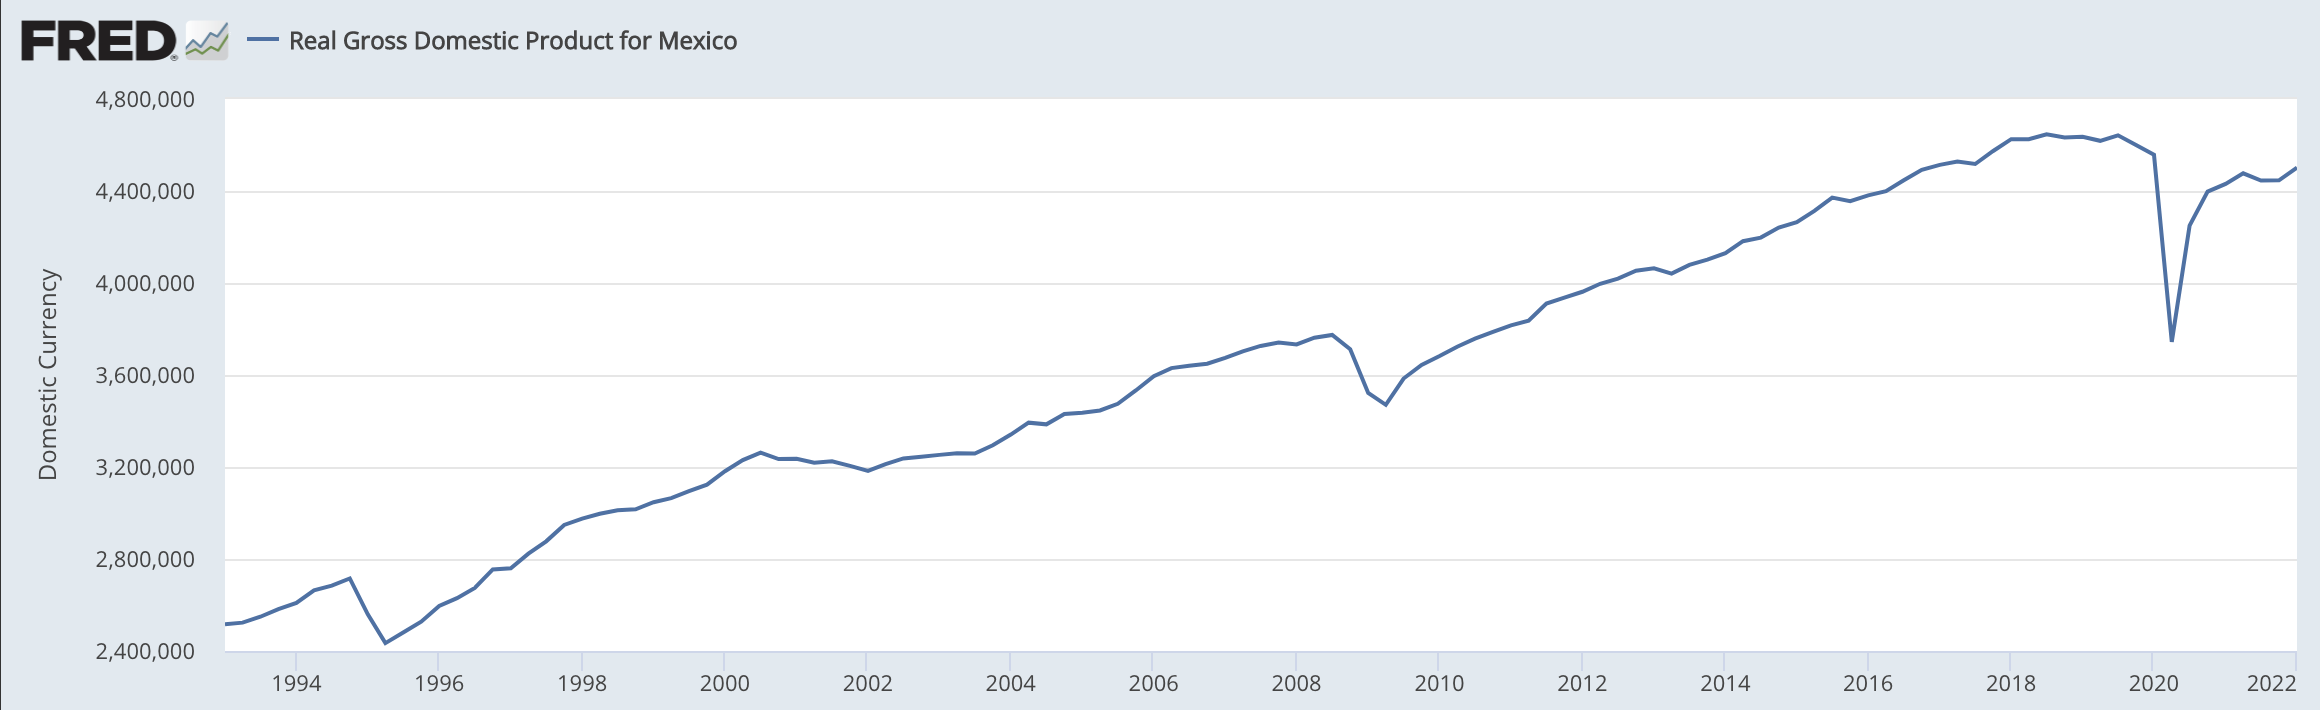
Yet cracks are obvious. First, growth has slowed to a sputter in recent years, while the pandemic has left the economy smaller than it was before. As the graph below shows, real GDP plateaued started in 2018, while the slash of the pandemic has only partly been recovered.
Mexico's debt-to-GDP ratio is well below countries like Italy and Greece, and even well below the US, but it's the direction of that ratio and the slope of the line that matter most. On those counts, Mexico's debt-to-GDP ratio is a rising concern for investors, in particular its recent spike (graph below).

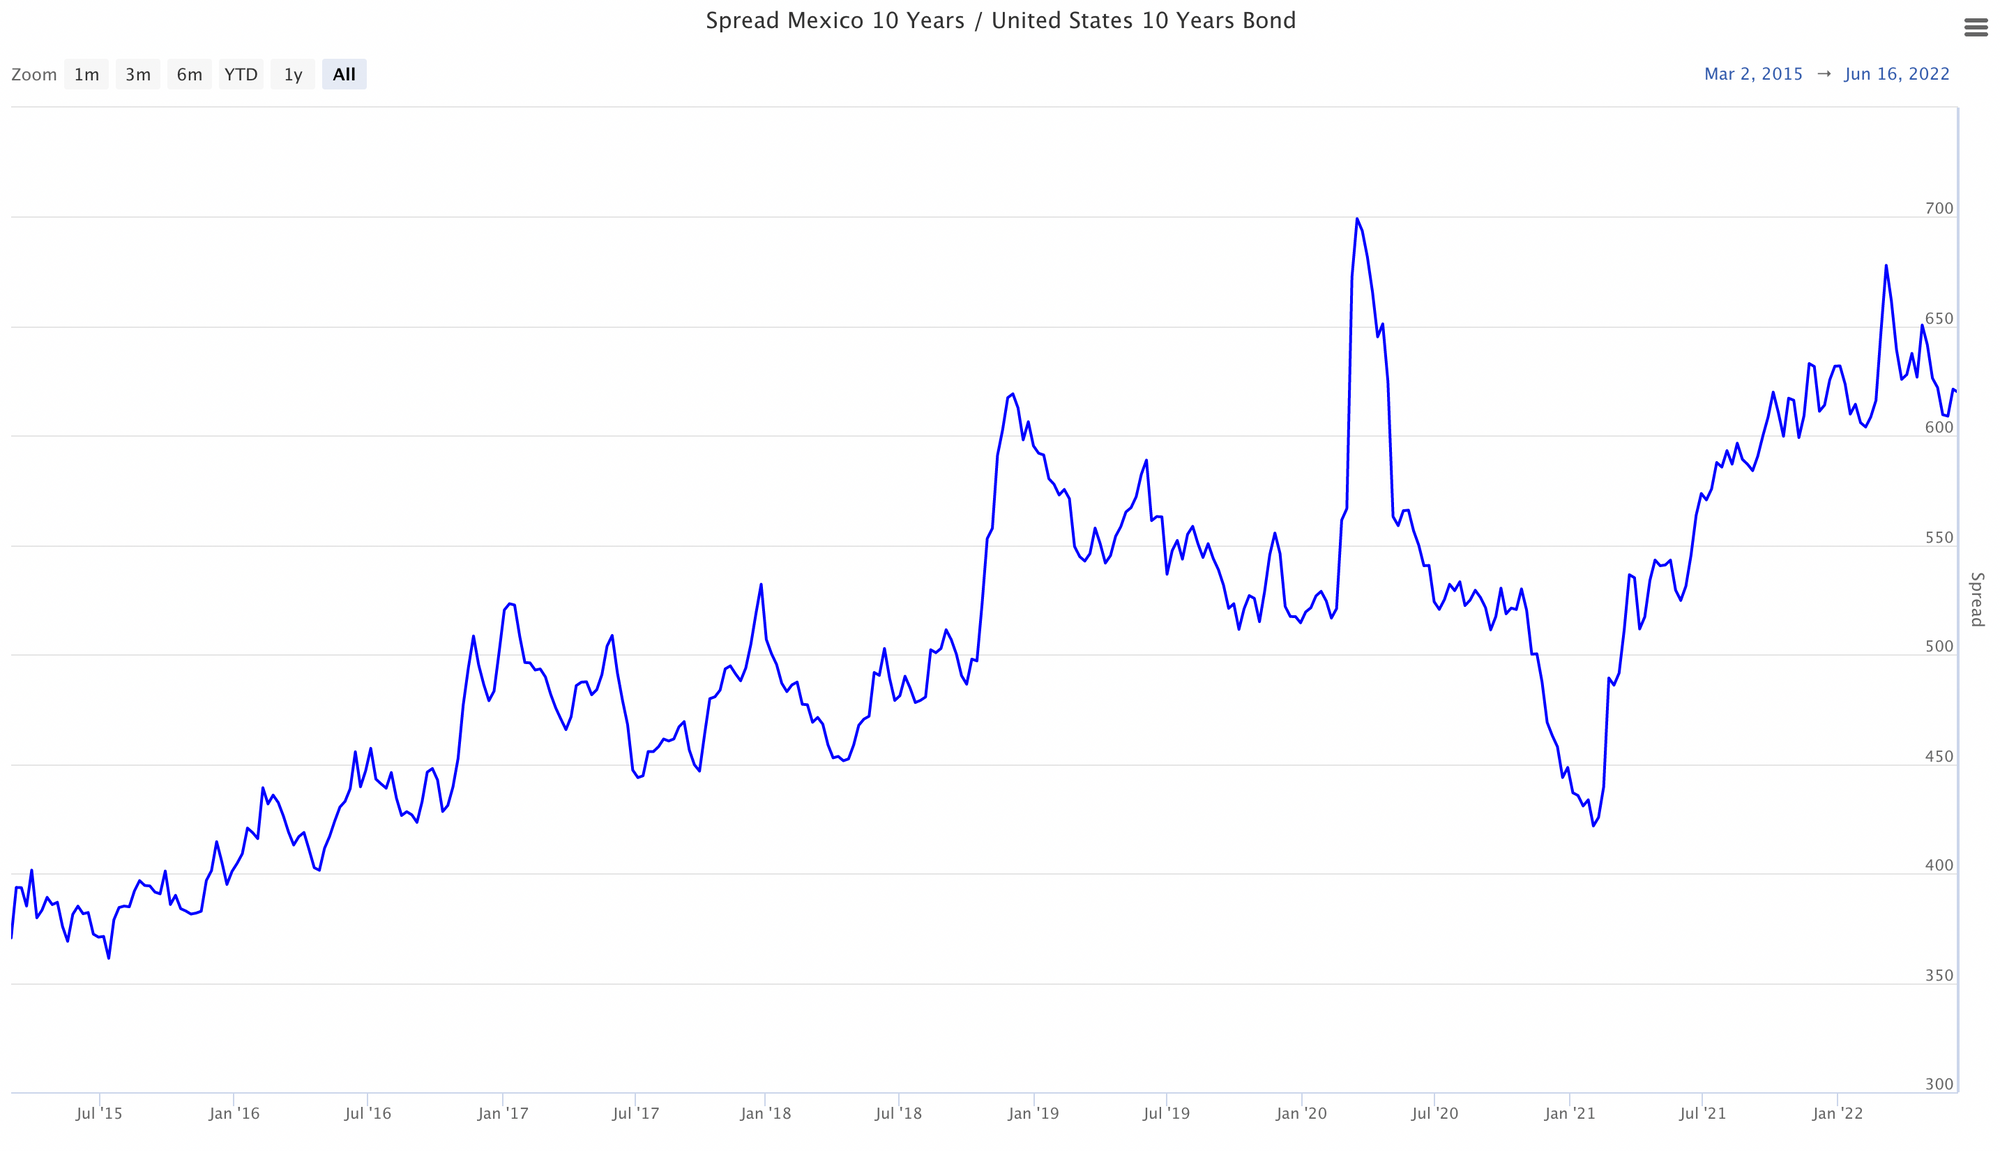
One product of these trends has been a rise in the spread between yields on the 10-year bond in Mexico and the US. That spread has been on a near constant march upwards for close to a decade, but the slope haas picked up in particular after a brief respite leading into 2021. At close to 620 bps, that spread sits at one of the highest points it has been in recent history. Recall from above that this spread is a reflection of diverging investor confidence in the two economies, and also that it has real consequences in the form of higher borrowing costs for Mexico, which (recall from above) has a higher and higher debt burden to service.
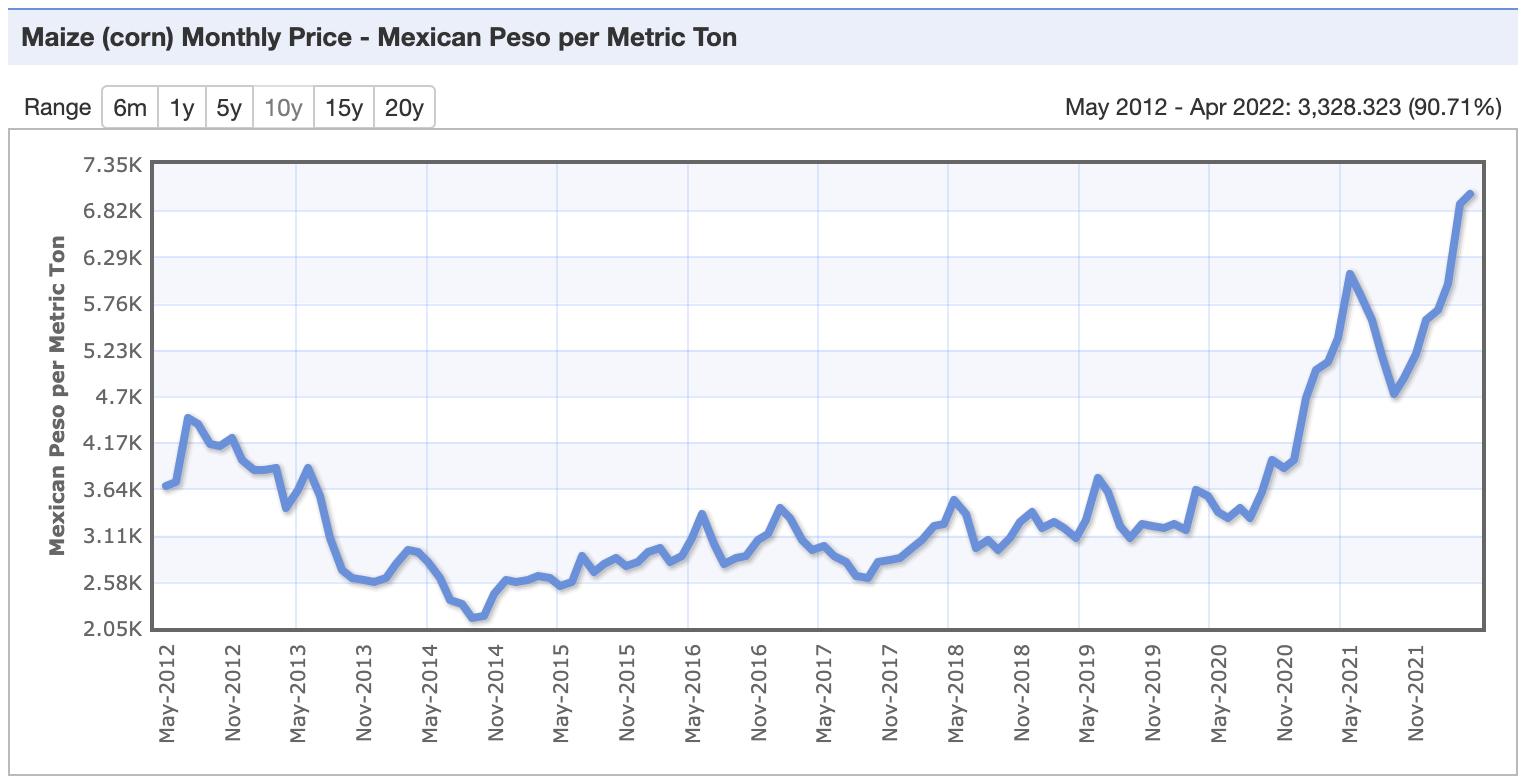
Like most countries in the world, Mexico is suffering from food inflation – for Mexican households, it's at a two-decade high today. The price of tortillas, from which many households get a large fraction of their daily calories, has risen by 20% in the past year, while the price of corn (graph below) has doubled over the past two years.
The Mexican government has seen no option but to intervene on food prices. Recently it removed duties on key food imports. Yet, it isn't obvious that move will have much of an impact on household finances given that the targeted food items account for only 11.4% of the CPI basket. It will however come at a heft price to the public purse – the equivalent of 2% of GDP. The government has also brokered a deal with businesses to increase the domestic production of staples.
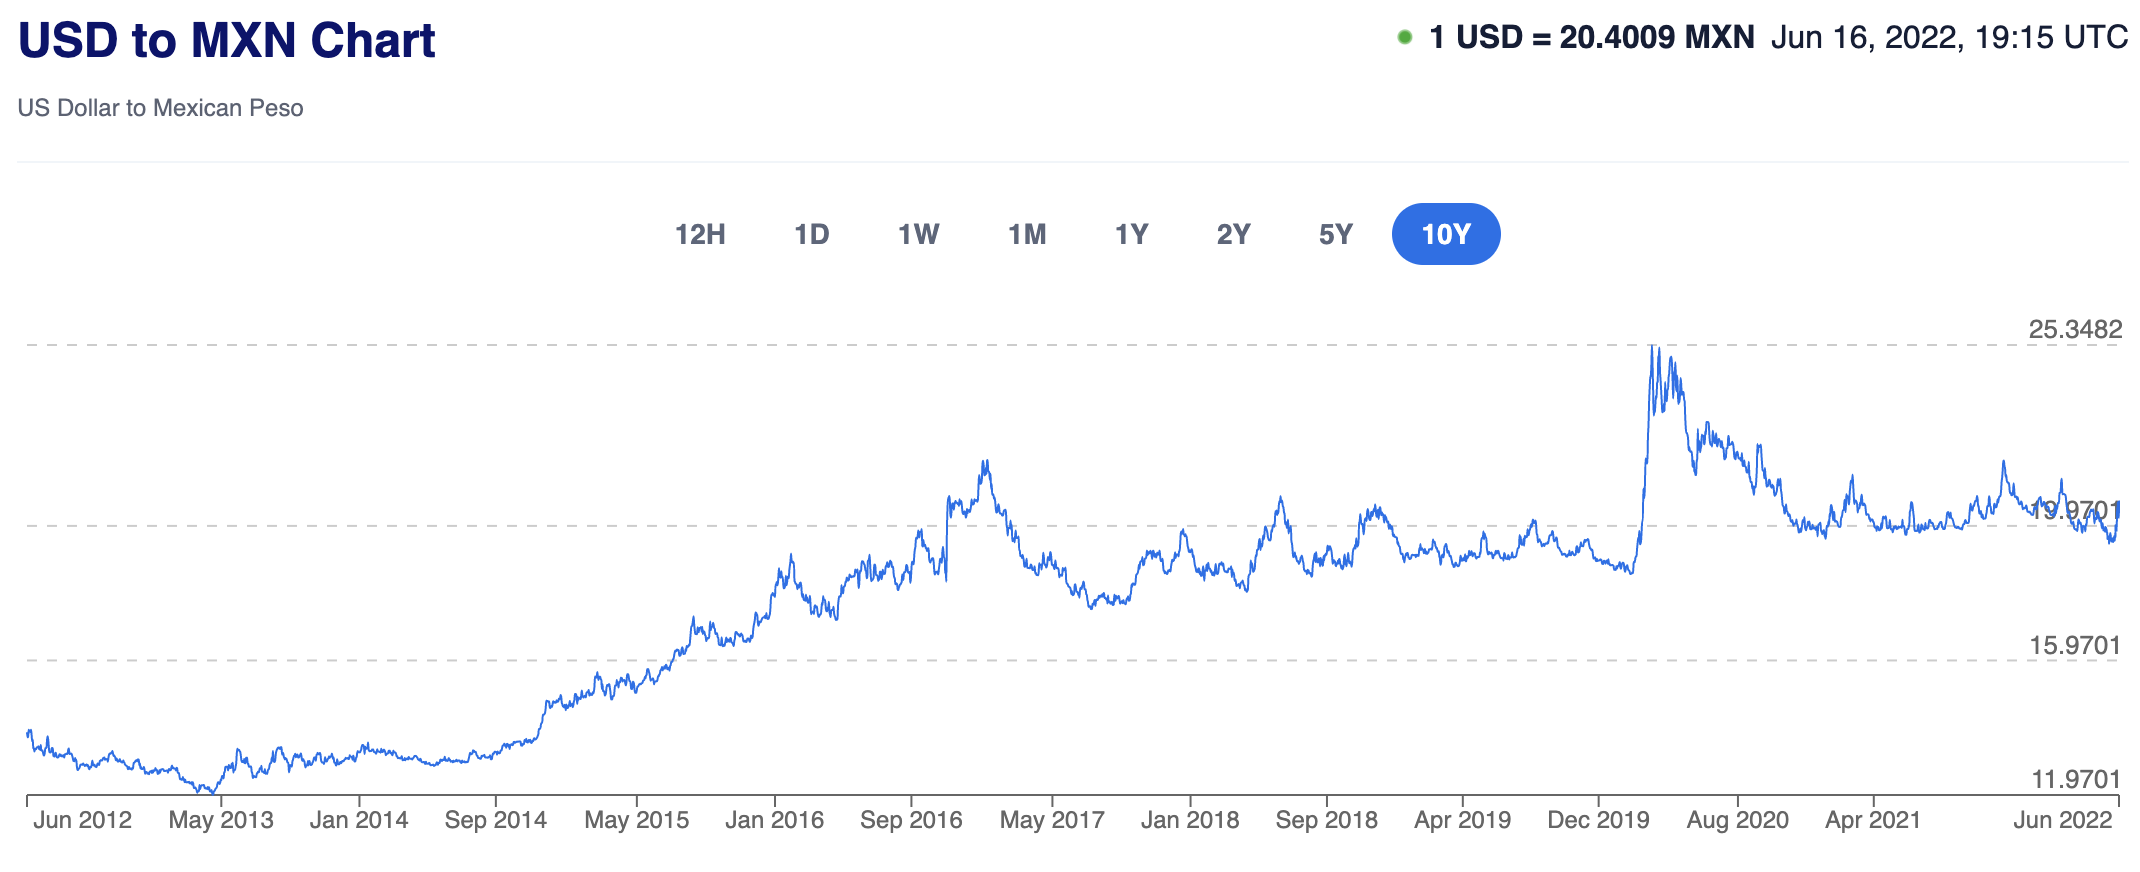
Food inflation is aggravated today by Mexico's deteriorating terms of trade with the US. While the peso has been amongst the best performers of emerging market currencies in the current uncertainty, it has not been completely protected from the dollar's strengthening. The graph below shows the USD-MXN exchange rate over the past 10 years. Since the initial pandemic spike in early 2020, the peso has surged back against the dollar, but has not regained all its previous strength, plateauing a good 5% lower than the pre-pandemic period. In the past week and a half alone, the peso has depreciated roughly 5% as key global central banks (US Fed, ECB, SNB) turn more hawkish to tame inflation and the likelihood of a hard landing (read recession) increase substantially.
That exchange rate environment matters a lot for Mexico because its economy has become dramatically more integrated into global trade flows over the past three decades since signing the GATT and NAFTA trade agreements. Today the US purchases 82% of the country's food exports and is responsible for 69% of its food imports. While food inflation is being driven by supply side problems (weather events, Russia-Ukraine war), a weaker peso makes the situation worse by aggravating price increases. That is particularly true for goods imported from the US, like corn and soy; but it's also true for goods produced in Mexico but where the price of those goods is heavily shaped by US buyers, like avocados.
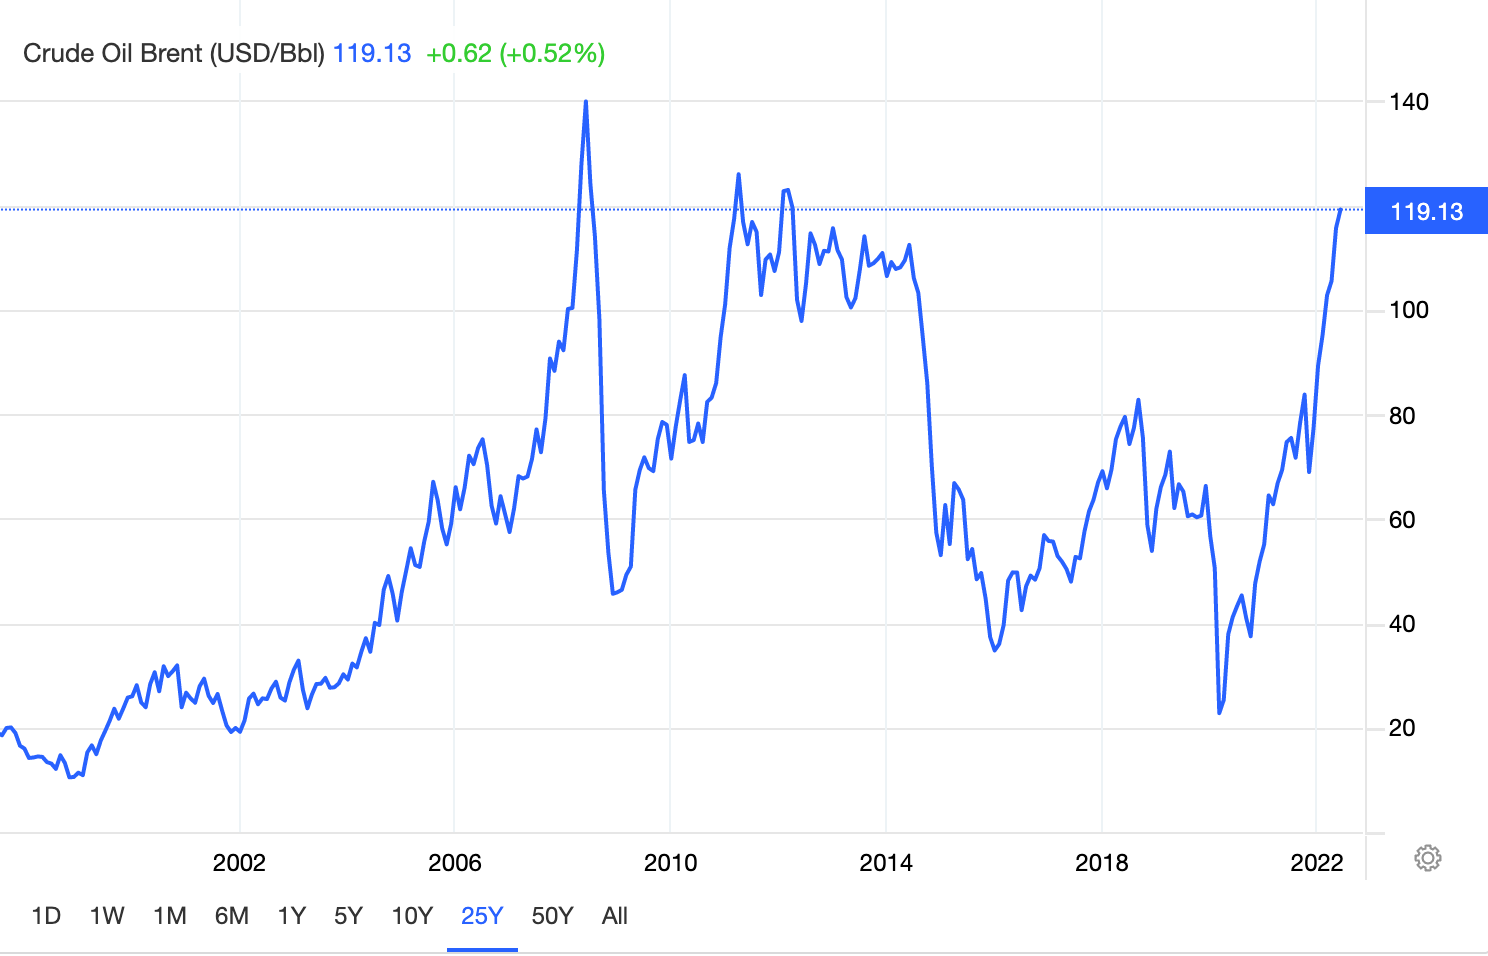
All of that adds up to increasing strains on Mexican households and the country's economy. To be sure, things could be worse. Mexico is the fourth largest producer of crude oil in the Americas – in a context of soaring oil prices (see graph below), that matters a great deal. But even this comes with some vulnerability. With a recession looking increasingly likely sometime in the next year, high oil prices risk turning into a rout as demand dries up in relative terms.
A recession in the US would imply a recession in Mexico. The costs risk being higher in the latter than in the former as recessions tend to see capital flee to safer jurisdictions, like the US. Mexico might be considered amongst the safest of emerging economies, but it won't escape that flight to extreme safety. That implies an increasing spread on long term bond yields, a deteriorating exchange rate, and all of this while food prices seem likely to stay high given their largely non-discretionary nature and the fact that supply side challenges won't disappear in an economic downturn.
Increasing migration northward is already evident. After two decades of declining migration to the US, it's clear that the trend is now moving in the opposite direction. By 2020, Mexican citizens outnumbered non-Mexican citizens in US border apprehensions for the first since 2015 (graph below).

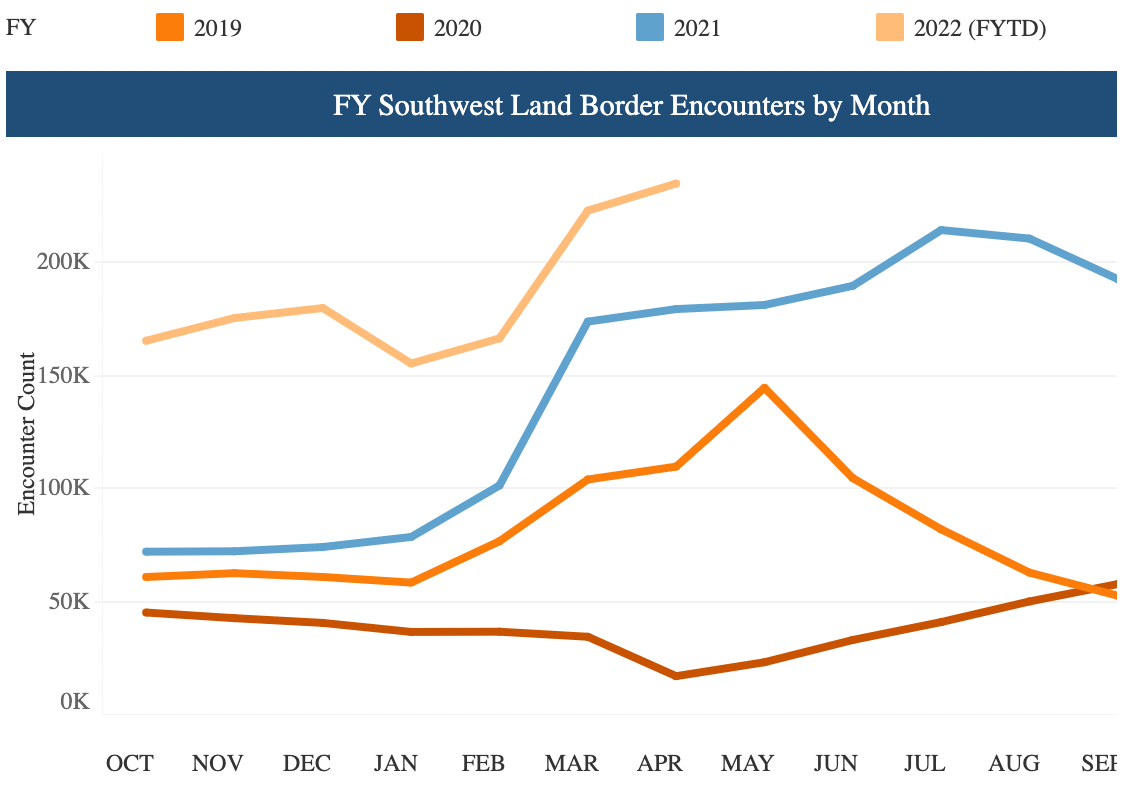
The years 2021 and 2022 have seen big increases in border encounters with unauthorized migrants, with an especially large rise starting in March of 2021 (graph below), precisely when the spread between the Mexico-US 10-year bond yield began rising at a rapid pace.
These Mexican migration numbers pale in comparison to the late 1990s, but they are significant nonetheless, in large part because they foretell a shift not simply a blip. This is no doubt one of the reasons that spurred Biden's recent signing of a migration pact with key Latin American leaders at the Summit of the Americas.
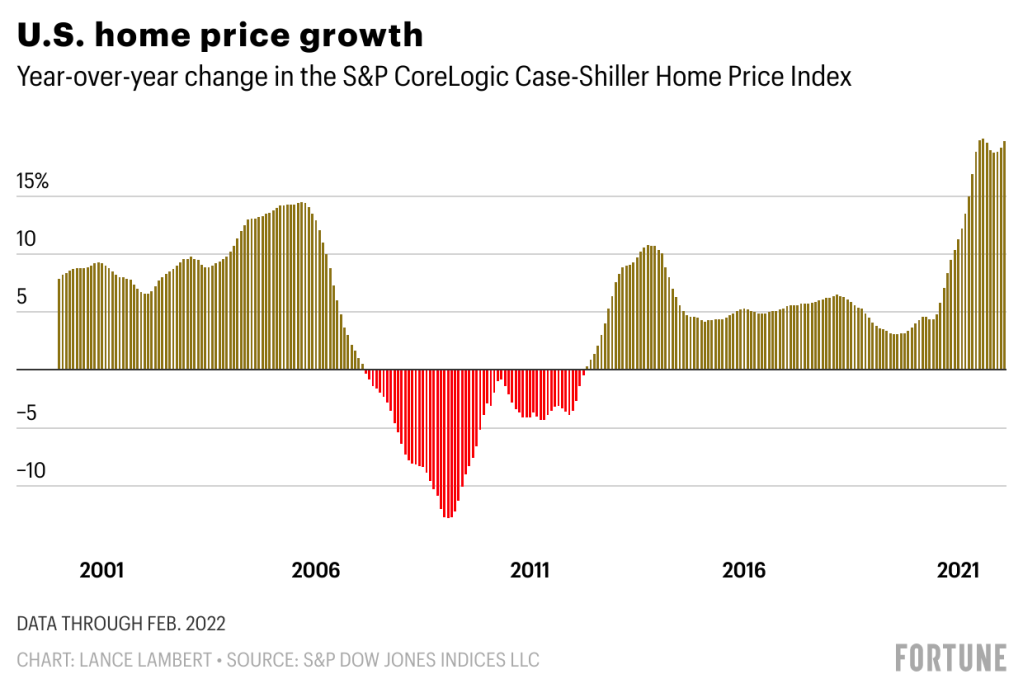
Turning to the housing market, an uptick in immigration promises to add demand at a moment when the for-sale and for-rent markets are already white hot (graph below for the for-sale side). Yes, rising mortgage rates are already cooling the for-sale market, but the aren't cooling the overall housing market much because households dropping out of the for-sale market are entering the for-rent market, which implies a shift in demand from one to the other, not a collapse in demand for shelter altogether. Recent research on headship rates (ratio of number of households to number of adults) in the US has show that household formation actually increased in pace in recent years; demand destruction overall would need to involve reversing this trend, which won't happen overnight.
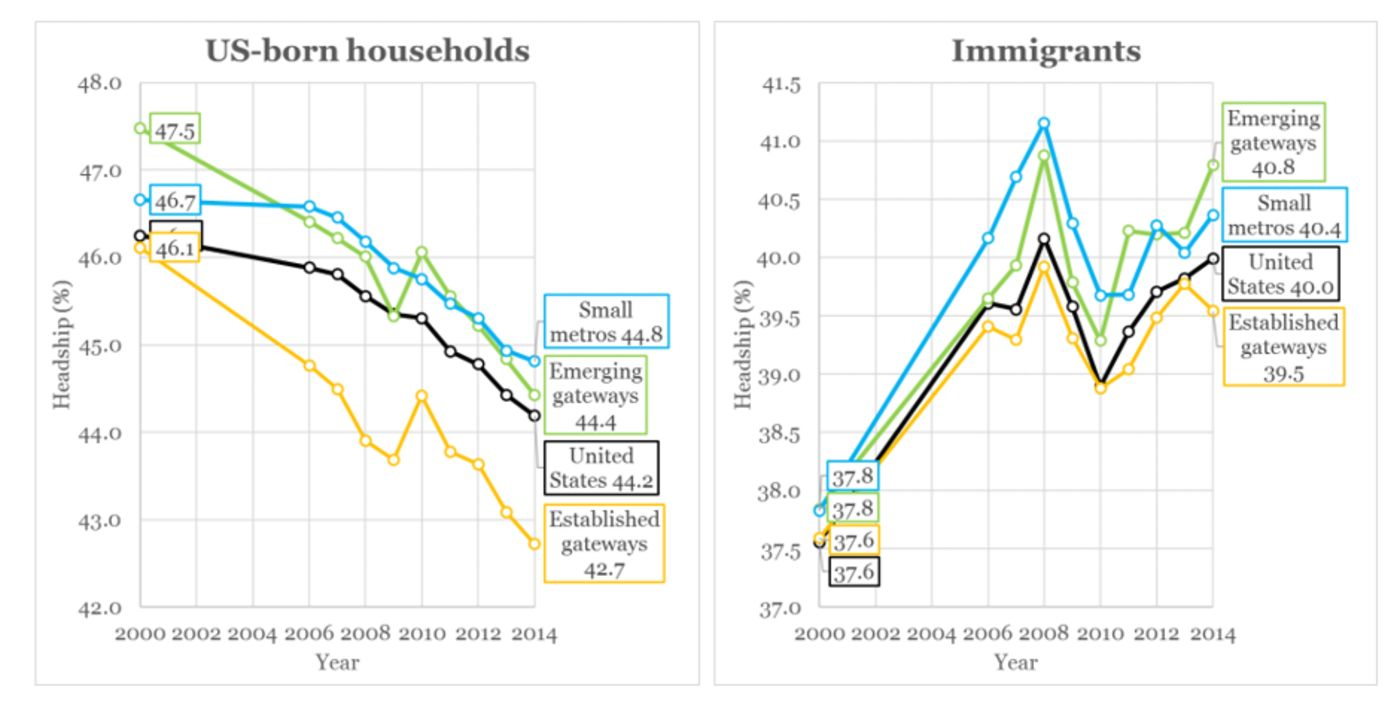
Migration injects new demand both directly and indirectly. New immigrants need housing right away – perhaps not on a one for one basis, but at some non-zero level. Beyond this obvious impact, the headship rate for immigrants has risen significantly in recent decades, while it has declined precipitously for the US-born population (graphs below).
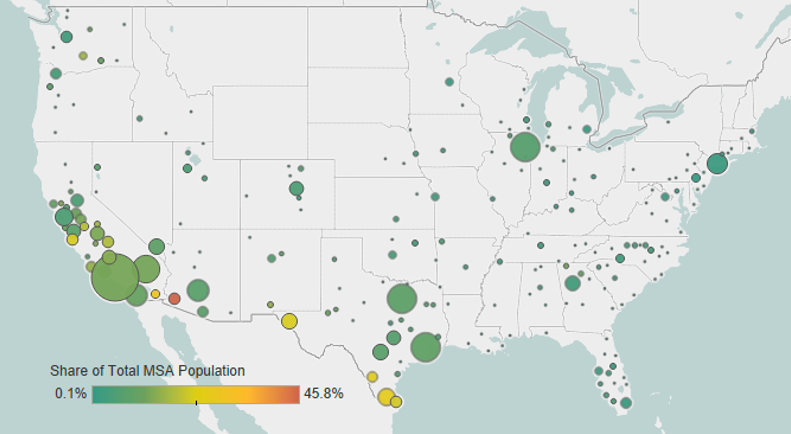
The effects of rising Mexican immigration won't be felt evenly throughout the country. Mexican immigrants are more likely to settle where Mexican populations are already concentrated, assuming work and housing can be found. The map below shows where the Mexican immigrant population is most concentrated today.
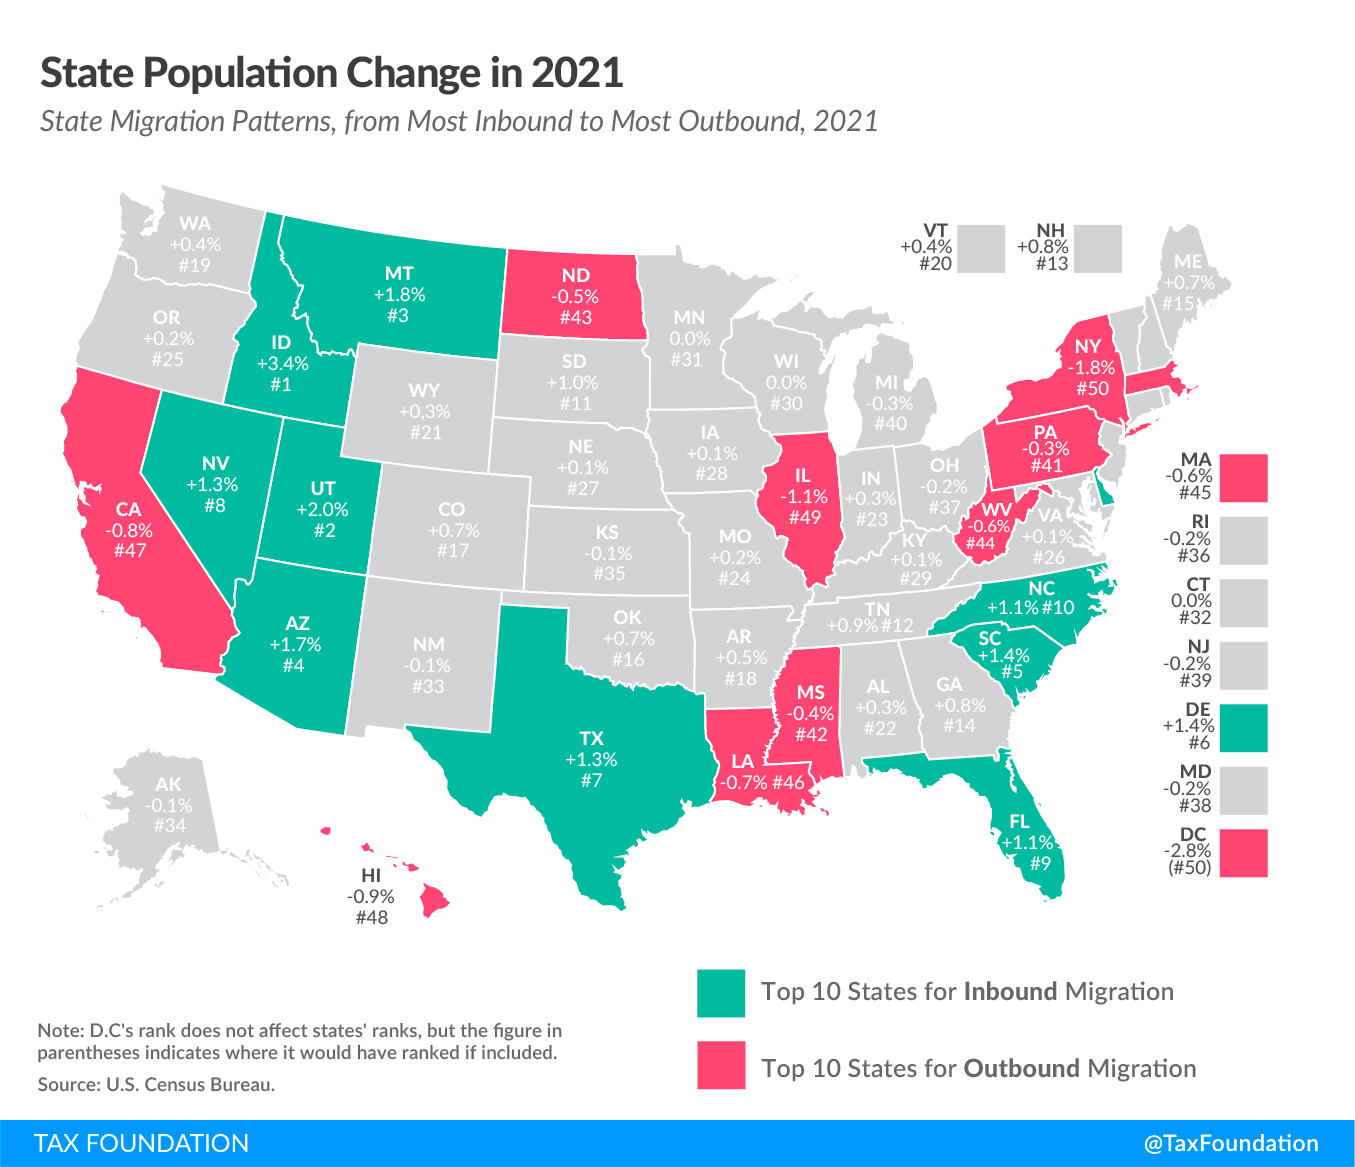
A lot of that concentration is in California, Texas, and across the Sunbelt broadly. Some of those states are seeing roaring growth in home prices and rent levels – in particular, Texas, Arizona, and Florida. Others, like California, are seeing a flattening. Those trends map directly onto domestic migration patters, with surging markets seeing high levels of in-migration and suffering markets seeing the opposite (map below).
In large part, those migration patterns are being driven by differentials in housing affordability. Housing costs in California and states in the Northeast have proven to be much higher than in other states, including those throughout the Sunbelt. By way of example, one 2018 analysis showed that, in order to afford average rent, households needed to earn almost twice as much in California as they did in Texas or Arizona (map below).
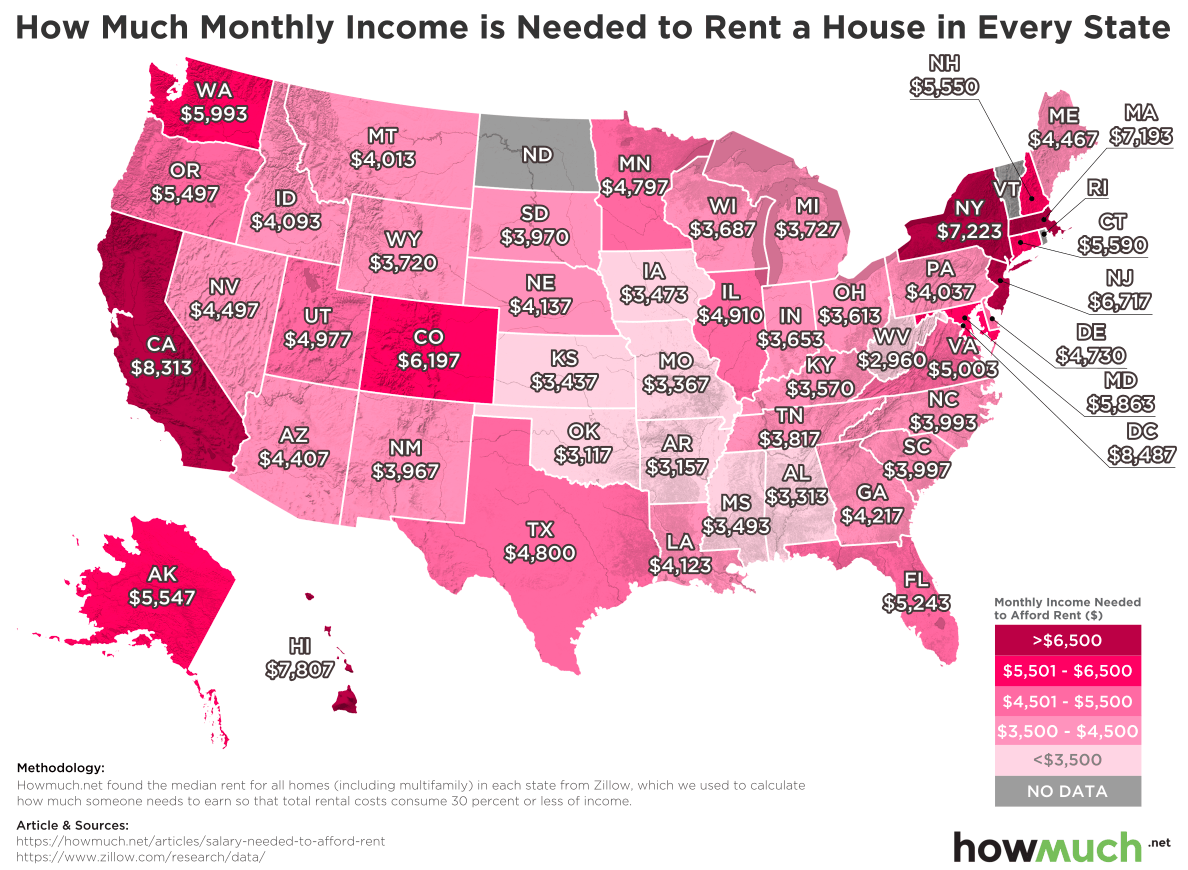
The surge in demand in lower-cost gateway cities has led to some convergence, with home prices and rents growing faster there than elsewhere. But the affordability differential is still real, making states like Texas and Arizona particularly attractive destinations.
Taken together, what appears likely is a sizeable increase in migration northward across the US-Mexico border into Texas, Arizona and some other Sunbelt states. That adds up to more fuel on the fire for home prices in some of the hottest housing markets in the country.