Inflation, household debt, and cross-border risks threaten housing

In this edition:
- Housing inflation will surge even as the housing market cools
- China's looming re-entry means building costs will soar even in the face of a recession
- Currency, geopolitical and regulatory risks threaten Gramercy's bet on Chinese real estate debt
- Household debt levels pose big risks for Canada's housing market and economy compared to US
Housing inflation will surge even as the housing market cools
Data releases from the last few weeks suggest that the US housing market is cooling in response to higher mortgage rates and the increasing likelihood of a recession sometime in the next year. But despite this cooling, we can expect housing inflation to actually accelerate and stay high well into 2023-24. With shelter costs making up a hefty portion of our inflation measures, this means that inflation could stay high even as unemployment rises and the economy enters a downturn. Not a pretty sight. What's going on here?
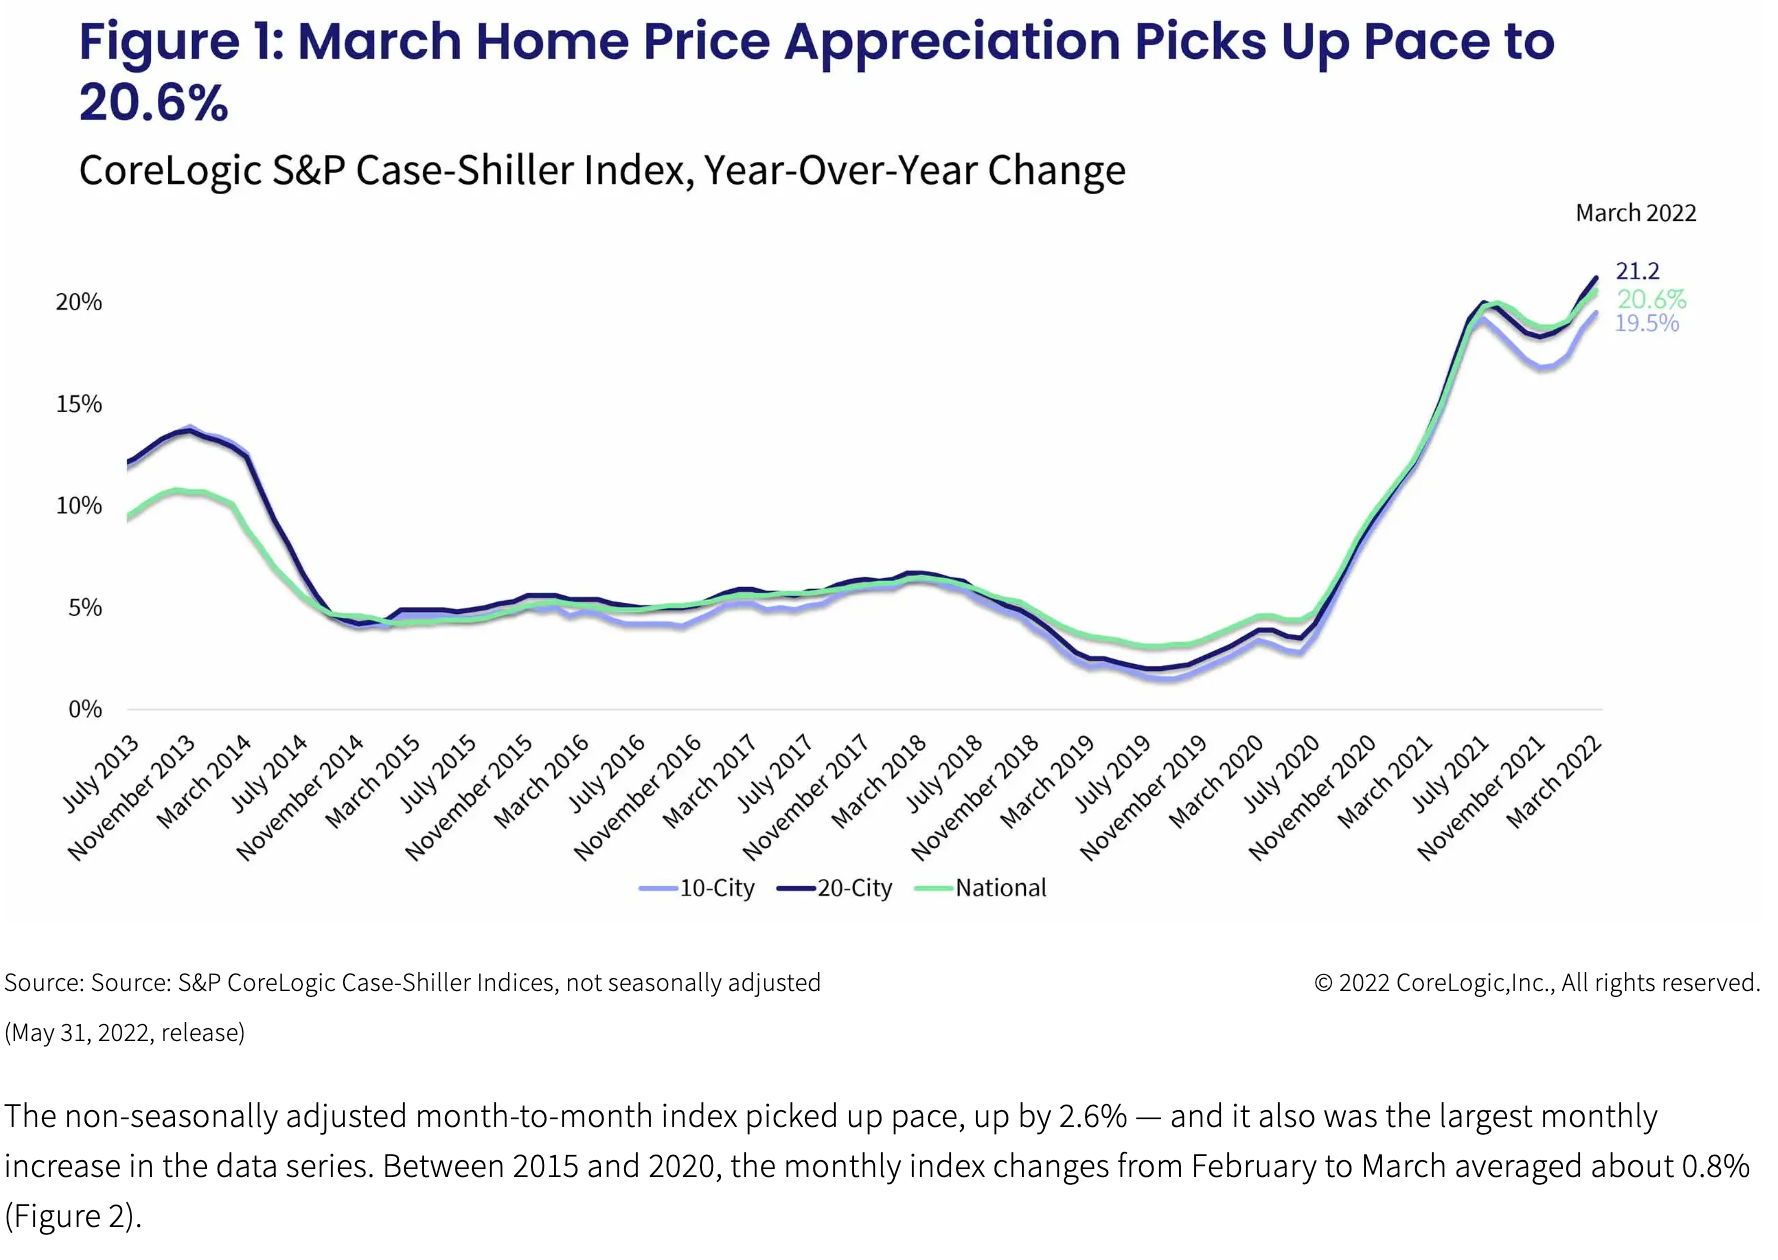
The US housing market – both for-sale and for-rent – has been white hot in recent years. The graph below (for for-sale homes) makes this obvious.
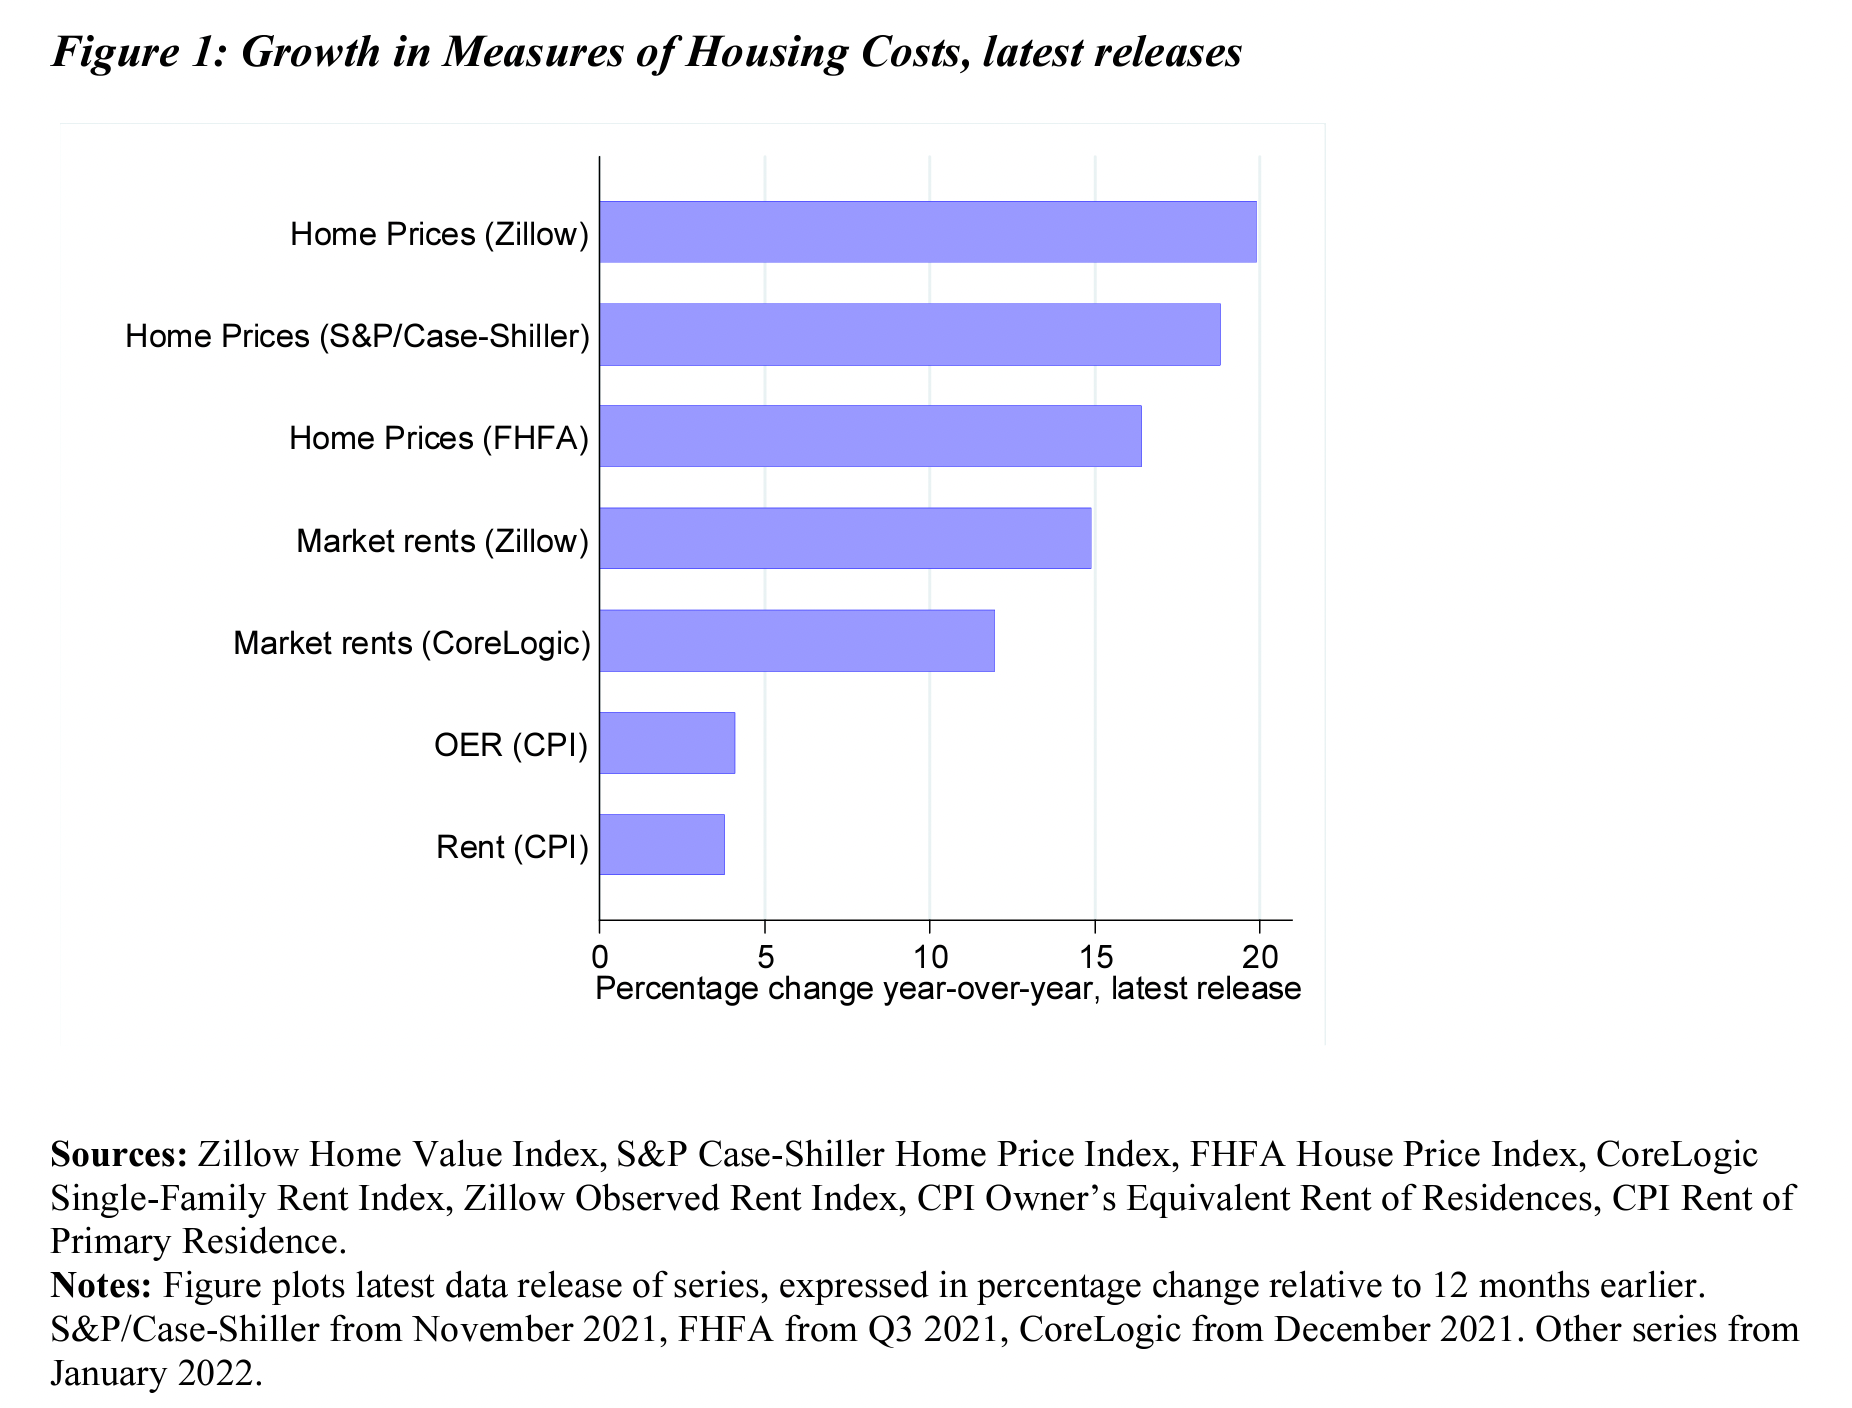
Yet, while year-over-year price growth for home sales has been been upwards of 20%, the housing component of widely accepted measures of inflation has been considerably lower. In the chart below, we see that well-known housing cost indexes, like those from Zillow, Case Shiller, and CoreLogic, have shown year-over-year growth in the range of 12-20%, while the two components of housing inflation included in the Consumer Price Index (CPI) published by the Bureau of Labor Statistics (BLS) – rent and owner equivalent rent (OER) - were closer to 3.5%.
The graph below offers an over-time view of the same, focusing specifically on the rental inflation.

To complicate things further, recent data suggests that the US housing market is cooling in the face of higher mortgage rates and the early signs of economic downturn. Inventory (homes for sale) is rising after having been extremely low for some time. New housing starts (breaking ground on new construction) have declined for both single-family homes and multi-family projects, while completions (finishing off projects that are already underway) increased, suggesting developers are halting new projects and instead focusing on finishing whatever is already underway. While sellers frequently got more than asking price in recent years, price cuts are now becoming more common. Lennar, the country's second largest homebuilder by homes sold, told investors in its Q2 earnings call this week that it was starting to resort to cutting prices and offering buyer incentives to encourage purchases in some markets.
Faced with these facts, we're confronted with two mysteries: 1) why is the housing component of official inflation measures so much lower than the housing price growth we see in well-known indexes?; and 2) given that the link between housing market hotness and CPI housing inflation isn't one-to-one, what will happen to housing inflation as the market cools?
The answer to the first question boils down to understanding how housing inflation is measured. For the most part, home and rent price indexes that show 12-20% price growth measure inflation for new home sales, new contracts signed, or simply new listings. In other words, they focus on what's in the market or coming fresh off the market through some purchase. By contrast, the two major measures of inflation – the CPI and PCE – aim to measure prices paid for housing services in general. For households that rent, most are paying rent based on a contract signed at some time in the past, not in the most recent week or month, which means the rate of change in the price they pay for housing services isn't well reflected in measures that focus on new contracts signed. For households that own their home (paying a mortgage or otherwise outright own), the CPI and PCE estimate housing services inflation by calculating an owner's equivalent rent (OER), which measures how much they would need to pay in rent to live in their home if they did not own it. The important point is that the CPI and PCE capture housing inflation in general, while other well-known home and rent price indexes focus alone on price growth for new contracts signed, new homes sold, or new listings published.
Given these definitional distinctions, data suggesting a cooling in the housing market will clearly impact indexes focused on new contracts, new sales, and new listings much more than the CPI and PCE. An increase in inventory, time on market, price reductions, and so on – these things will have an immediate impact on price growth for new housing services, but a much smaller impact on housing prices paid (or assumed paid through the OER calculation) in general, at least in the short term.
That last qualifier – "at least in the short term" – is key because there is a relationship between price growth for new contracts and new homes sold, on the one hand, and general housing services inflation, on the other hand. It just isn't one-to-one and it isn't immediate. Research by Bolhuis, Cramer, and Summers and Zhou and Dolmas offers helpful insight on the lagged relationship between the two.
The graph below compares PCE housing inflation (which measures housing services inflation in general) and Zillow's home price index (which tracks new sales). Eyeballing the graph, we see that the Zillow index does have a relationship with PCE inflation, but that the relationship is lagged (and far from perfect!).
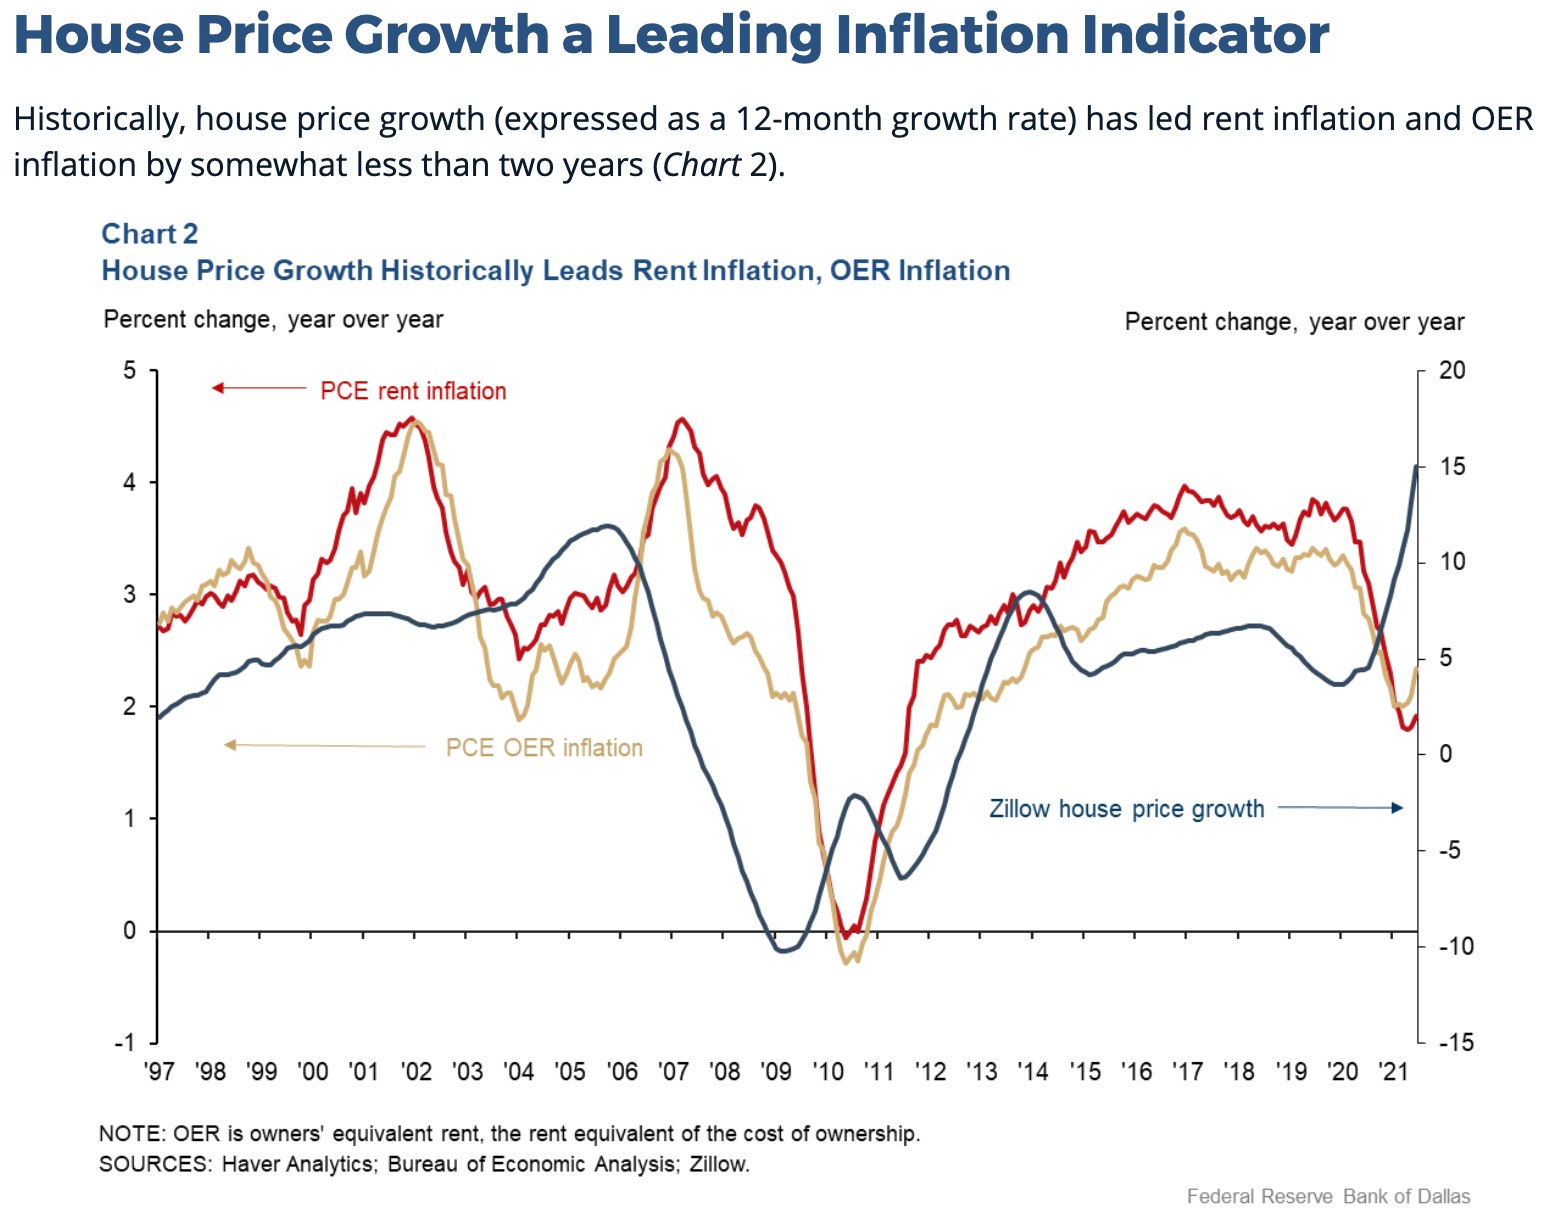
Zhou and Dolmas estimate that house price growth is a strong predictor (~0.75 correlation coefficient) of PCE rent and OER inflation 16-18 months later. They note that the relationship is similar for CPI rent and OER inflation.

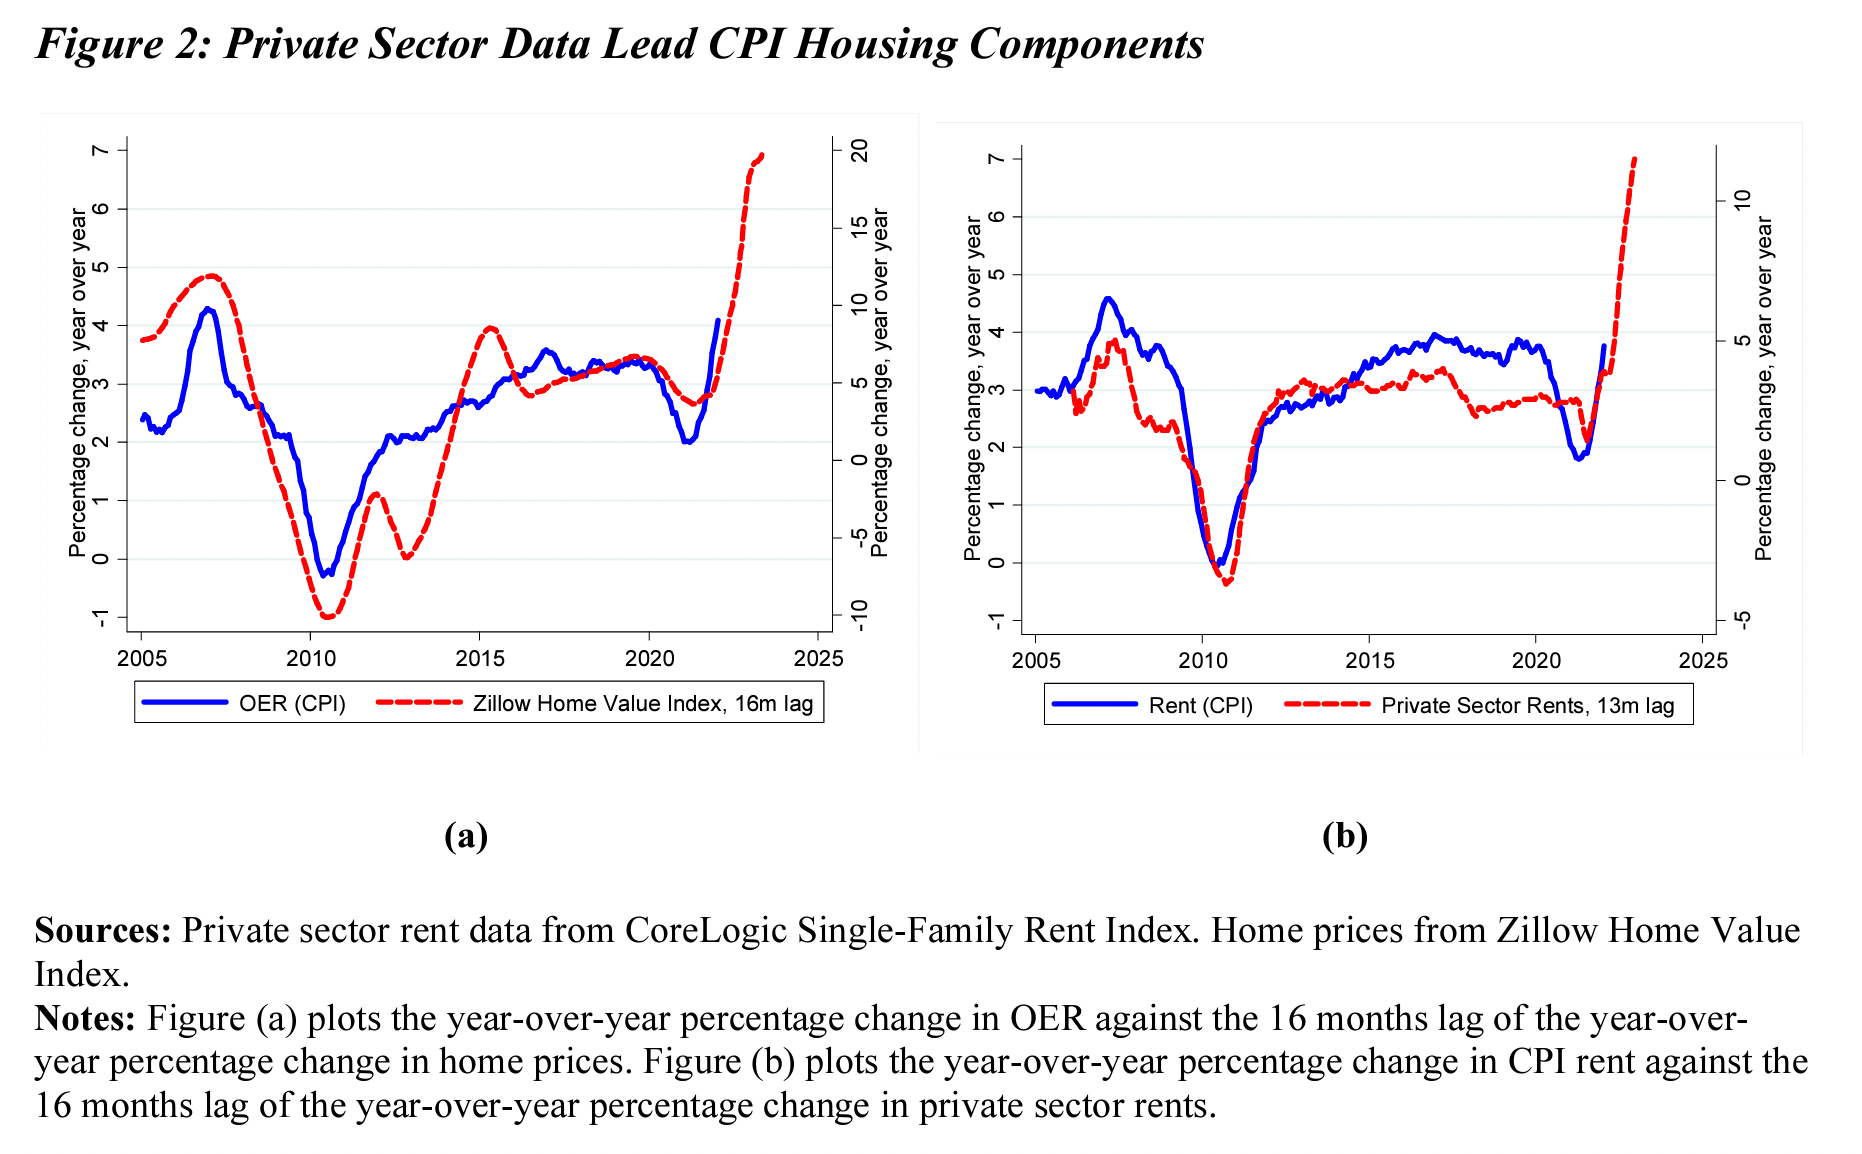
In separate and more recent research, Bolhuis, Cramer and Summers show that CPI housing inflation is robustly predicted using a 16-month lag on Zillow's home price index (for CPI OER inflation) and a 13-month lag on private sector rents (for CPI rent inflation) (see graph below).
So where does this leave us on expectations for housing inflation now that the housing market is cooling and as the likelihood of a recession grows stronger? The lagged effect means that CPI and PCE housing inflation will actually accelerate to reflect the accelerating home price and rental price growth that new contracts/sales indicators have shown over the last few years. Bolhuis, Cramer and Summers project that the housing component of inflation will rise over the course of 2022 and persist at high levels throughout 2023 before dropping off to reflect the current cooldown in prices and sales. The graph below shows their estimates for how much housing inflation will likely add to Core CPI and Core PCE inflation measures over the next two years.
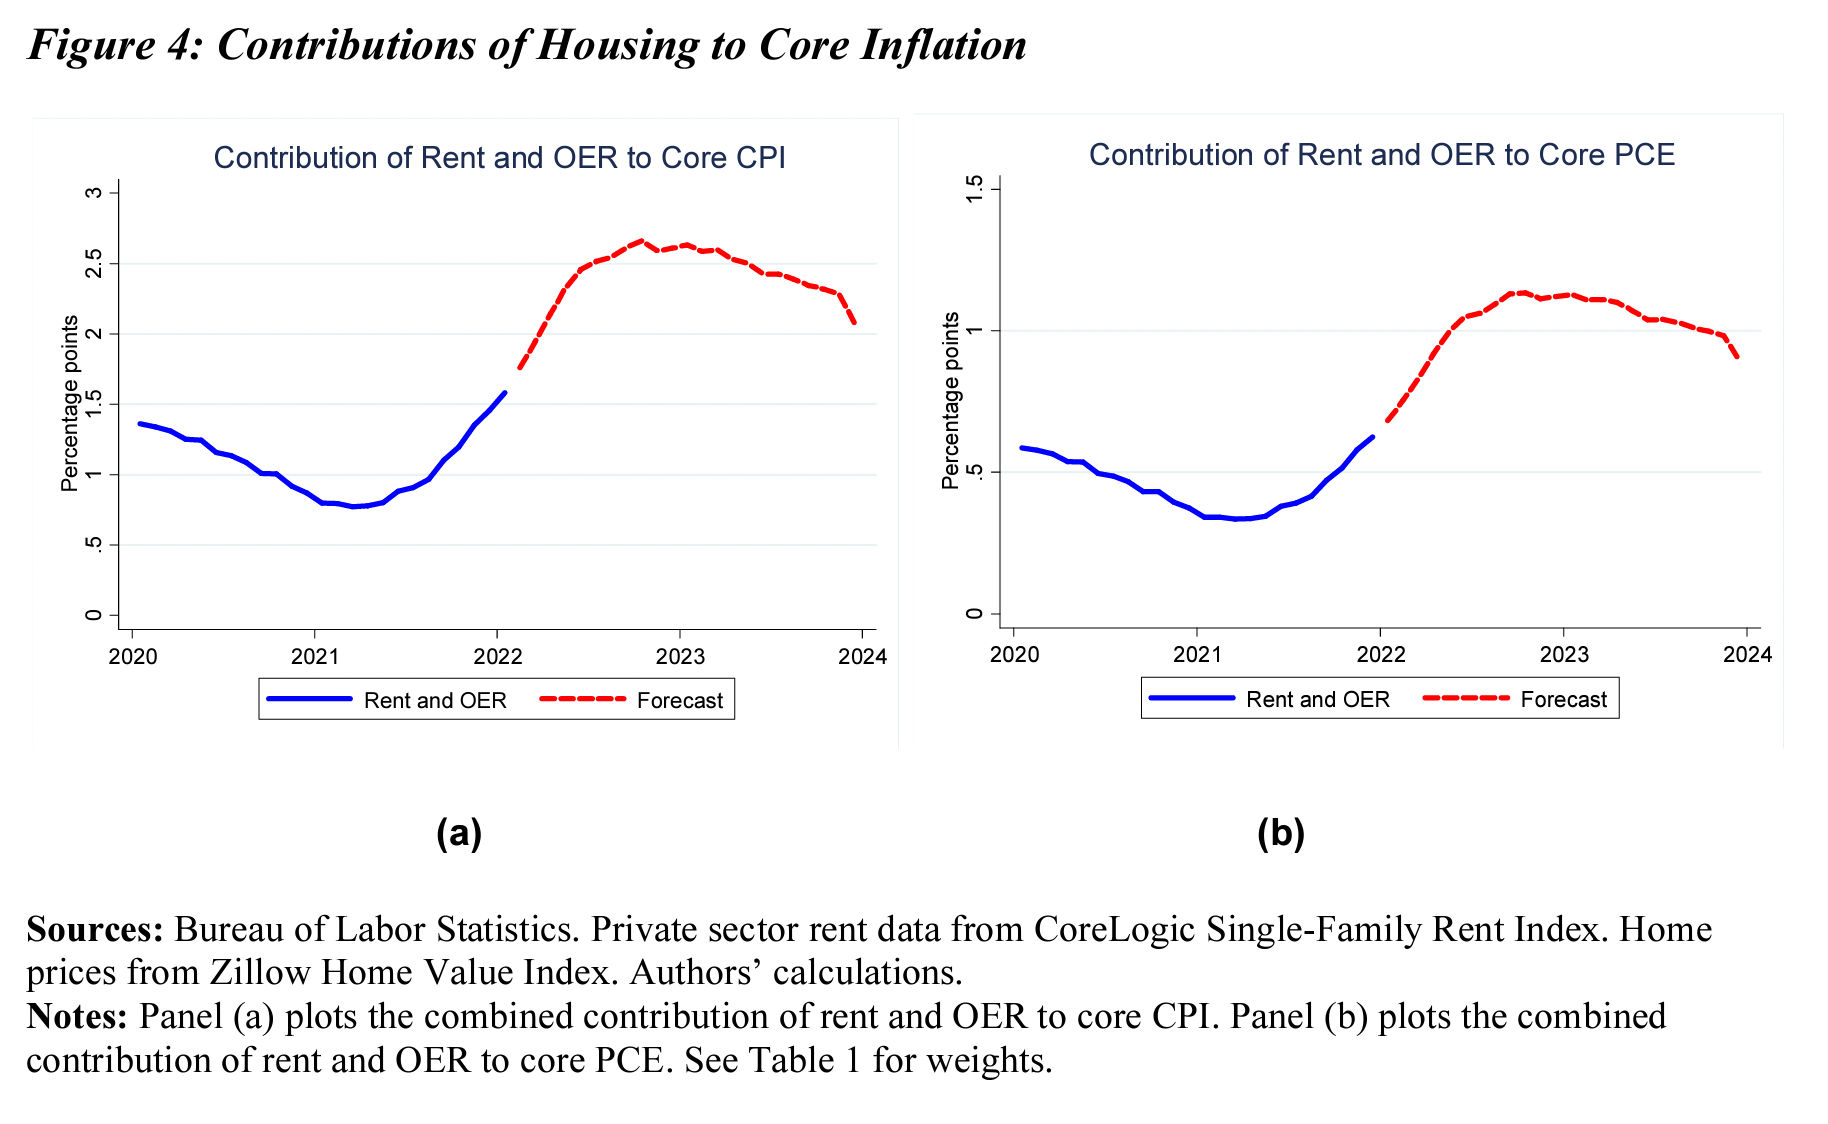
This lagged effect makes housing inflation a lot more sticky that inflation in other categories. That doesn't mean it will be structurally higher in the future than we've seen in the past – this might be true, but not for the lagged effect reasons discussed here. What it does mean is that the transitory parts of housing inflation – those due to over-heating caused in part by fiscal policy supports and loose monetary policy – won't disappear immediately, even if the economy heads into a downturn, household incomes start contracting (due to rising unemployment, slower wage growth), and household wealth takes a hit (due to diminishing savings, reverse wealth effect of equities plunging).
Will new supply come to the rescue? Not a chance. As I mentioned above, new housing starts are slowing as developers respond to a cooling market for homes. Supply, including new home supply, responds to the willingness of buyers to buy fast and buy high. On both counts, the market is cooling today, which cools new home and new h0using unit construction.
High housing inflation at a time of economic downturn and higher unemployment will add burn for households, even if the recession ends up being shallow, as many are projecting today. That's important for the wider economy because it means household disposable incomes will be stressed beyond the stress associated with unemployment, a reduction in hours worked, a slowdown in wage growth, and so on. That will impact households' capacity to consume, which could limit the economy's ability to surge out of the recession.
China's looming re-entry means building costs will soar even in the face of a recession
Soaring prices for building materials have been a big part of housing market strains in recent years. Is a reprieve in sight? Dissecting input inflation suggests that most input prices are already starting to moderate in the face of an increasingly likely recession, and that they would drop further once any recession starts. But over the medium term other factors will unleash pressure in the opposite direction, which will contribute to longer term housing inflation and make it that much harder to fill the massive housing supply gap that persists in the US today.
Let's start by putting the current period in historical perspective. The price run-up for building supplies during the pandemic has been nothing short of spectacular. The graph below shows the US Producer Price Index (PPI) for building materials. Note the dramatic uptick since the beginning of the pandemic, as well as the abnormal volatility (represented by huge swings up and down, the likes of which are not seen anywhere else in the historical series).

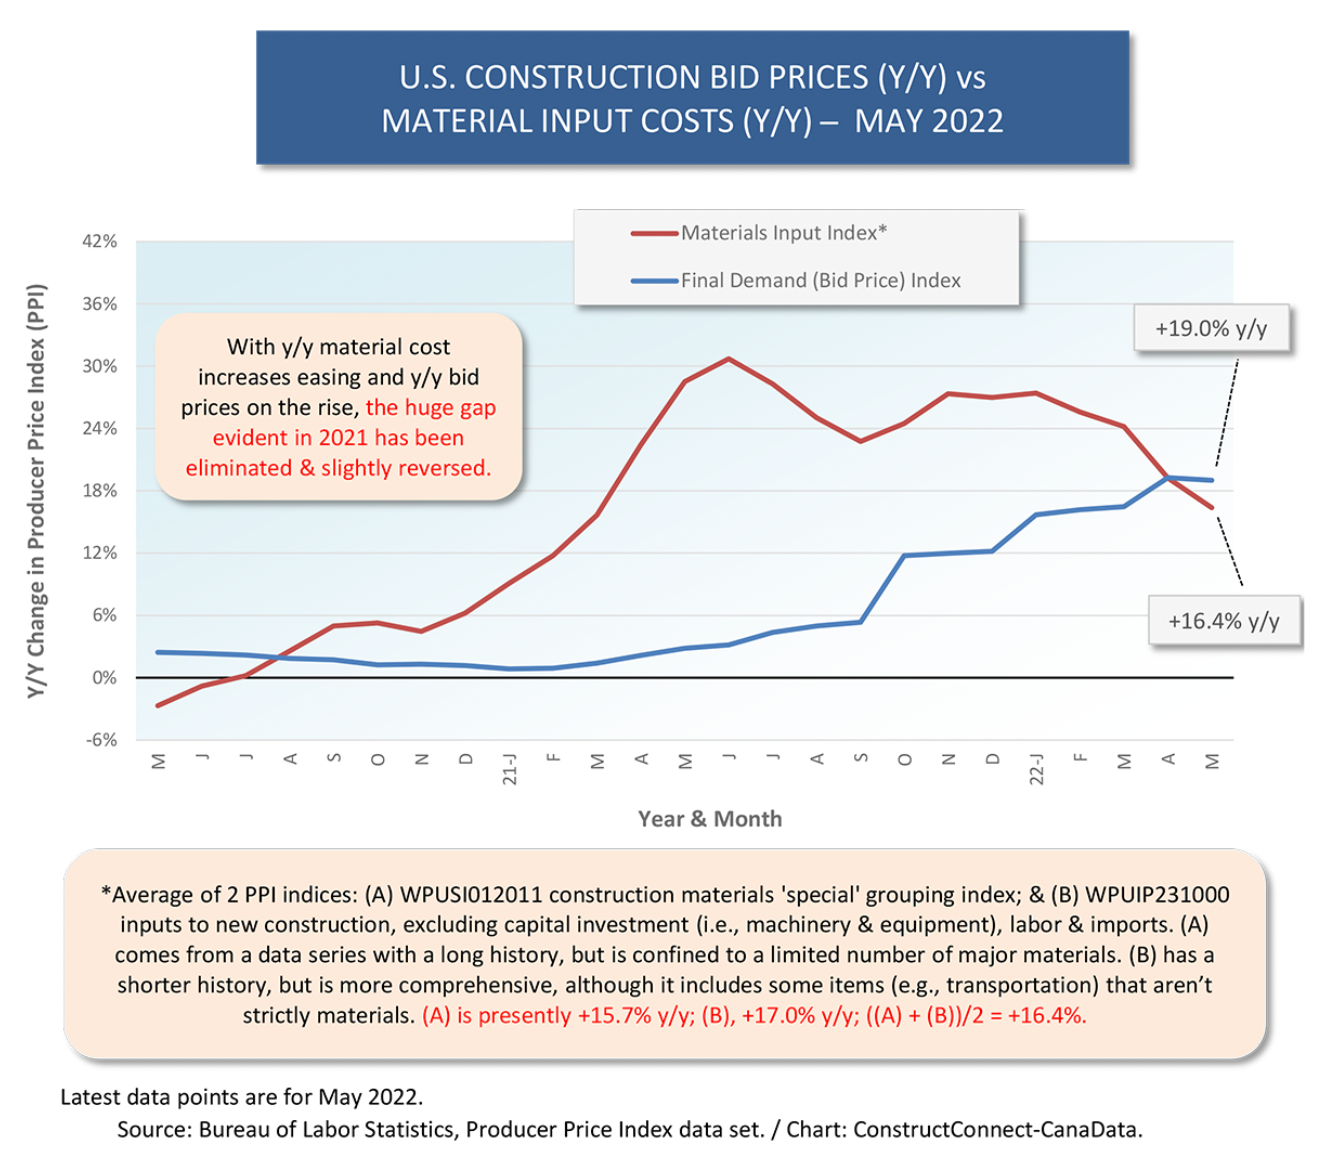
The talk of the town right now is that upward price pressure is moderating as producers and buyers respond to the increasing likelihood of a recession and as new home demand cools in the face of mounting mortgage rates. We can see that in the final downward-pointing segment in the graph above. We see it from a different perspective in the graph below, which compares year-on-year (y-o-y) change in PPI growth for building materials and y-o-y change in the bid price index, which tracks the prices contractors charge for projects. For the first time since the start of the pandemic, bid prices are outpacing material input costs.
Breaking input inflation down by category reveals important insights. The chart below compares key y-o-y change and change over the last 3 months for key building materials. Note that most categories saw a deceleration in recent months, but that considerable variation exists across categories. Forestry products stand out on the down side, while energy-related products (asphalt, gas, diesel fuel) stand out on the up side.
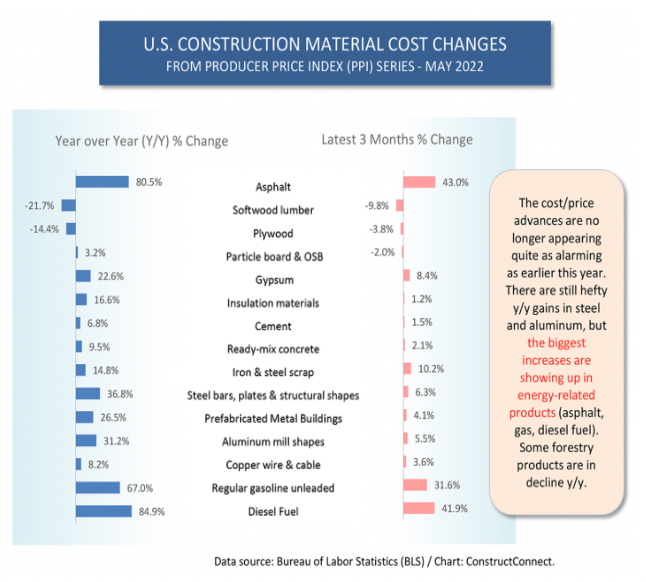
It's no surprise that energy-related products continue their upward march – the markets for crude oil, natural gas, gasoline, and diesel are global, touch virtually all sectors of the economy, and are in turmoil today due to supply shocks coming out of the Russia-Ukraine war. By contrast, prices in other categories are adjusting downward in the face of recession fears (most economists suggest it is a foregone conclusion) and an already-observed cooling in housing and building more broadly.
But there is good reason to expect that price indexes won't come down anywhere close to their pre-pandemic levels and might even see renewed acceleration in late 2022 and 2023.
First, China has been forced onto the sidelines for most of 2022, but it's just a matter of time before it roars back into the market. China is among the world's biggest consumers of many goods in the building supply basket, yet ongoing COVID lockdowns have significantly dented its economy, which has moderated price growth for key building materials over the past year. The graph below shows price evolution for copper, for which China is the world's largest buyer. Note the year-long stagnation in price in 2021-22 before the very recent price drop began. Similar trends can be seen for iron ore, steel, etc.
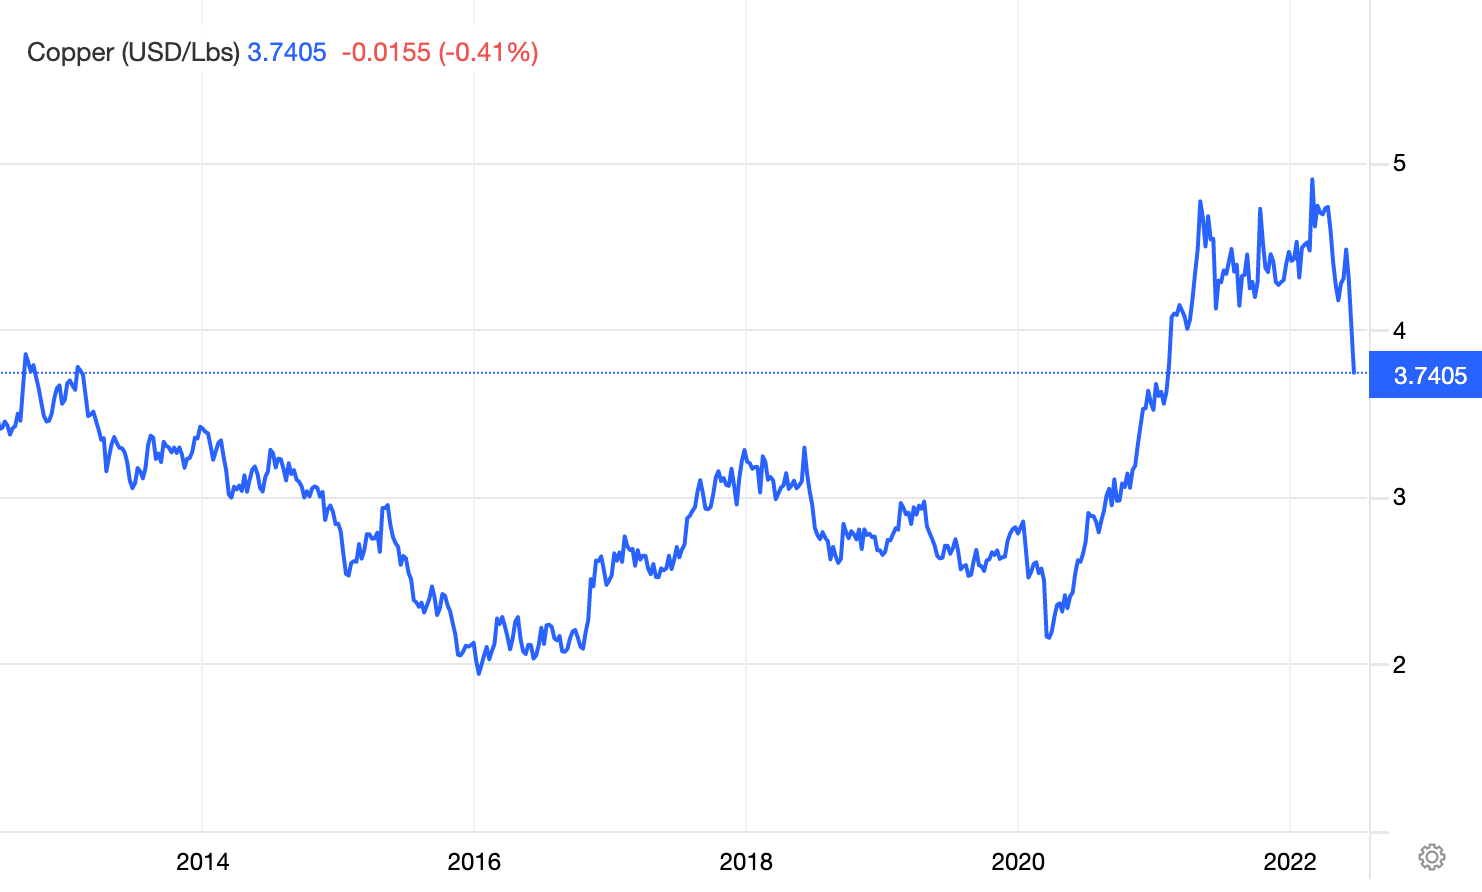
Recall from above that building material price growth has been off the charts over the past two years, driving overall input costs to new highs. Yet here we see that copper prices (as well as iron ore, steel, etc) have actually stagnated for periods of the past year. That means overall building materials inflation wasn't nearly as bad as it could have been had China been more present in the economy.
No one can predict when China will exit its lockdown problems, but it's clear that an exit will come at some point. Whether or not the US and other key economies are in recession at that point, China's re-entry will inject massive new demand, counter-acting any downward price pressure that the recession creates in the US.
Beyond China, the green transition will contribute to upward pressure on building material prices going forward. As companies, governments, and households invest to repair, renovate, replace, and build new in an effort to adapt to climate change, to mitigate it, to shift to new ways of producing/moving/living/etc, and to build in redundancies and other forms of resiliency, the world will see a huge spike in demand for building materials. Not all inputs in the current basket will be affected equally. For example, copper, a crucial ingredient in renewable power generation, energy storage, and electrification, will see particularly strong demand, while gasoline demand will be blunted by efforts to shift away from reliance on carbon-intensive inputs. Altogether, the green transition is likely to create structurally higher inflation for the building sector.
Currency, geopolitical and regulatory risks threaten Gramercy's bet on Chinese real estate debt
US-based distressed debt specialist Gramercy Funds is amassing a sizeable position in Chinese corporate real estate debt. That's significant because it cuts against an a much more negative outlook by other big investors. But also because big currency, geopolitical and regulatory risks loom on the horizon that could torpedo Gramercy's hope of a positive outcome.
China's real estate sector is in trouble today. That trouble started in December 2021, when Evergrande, the world's most indebted property developer and one of China's largest real estate companies, entered into default after failing to make payments on its debt. Other large developers entered the default spiral soon after: Sunac, Zhenro Properties, Kaisia, Fantasia. As problems spread in the sector, debt becomes much more expensive (see graph below), which makes conditions worse for developers not already in trouble.
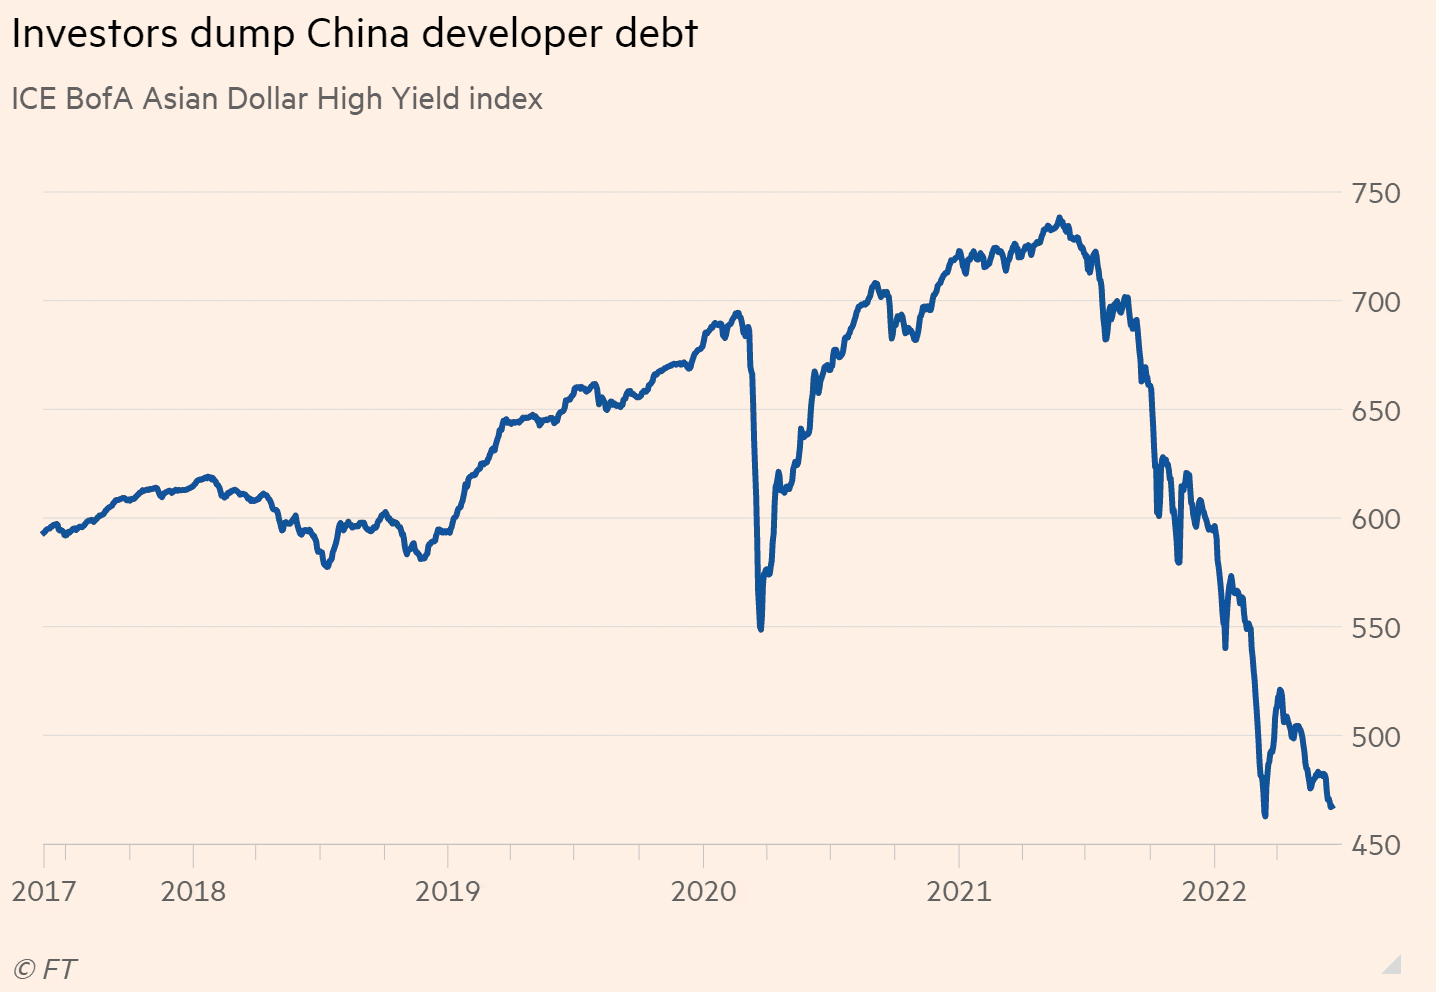
That these companies are in financial crisis doesn't necessarily make them bad investment targets. Distressed debt is a high risk investment vehicle with the potential for big payouts. Everything comes down to correctly pricing risk. And on this count, Gramercy is running against the crowd, as other major international investors see far too much risk at current price levels. Gramercy has gone from zero bond holdings to about $200M in holdings of distressed Chinese real estate bonds over the last year.
I can't say much about whether Gramercy's read of the fundamentals, but three macro risks stand out that call into question Gramercy's bullishness:
First, currency risk. As Japan's central back (BoJ) has relentlessly pursued its policy of yield curve control while other central banks tighten monetary conditions, the yen has depreciated dramatically against the dollar to a two-decade low, while the Chinese yuan has moved much less. The graph below compares movements in the two currencies against the dollar since the beginning of 2022.
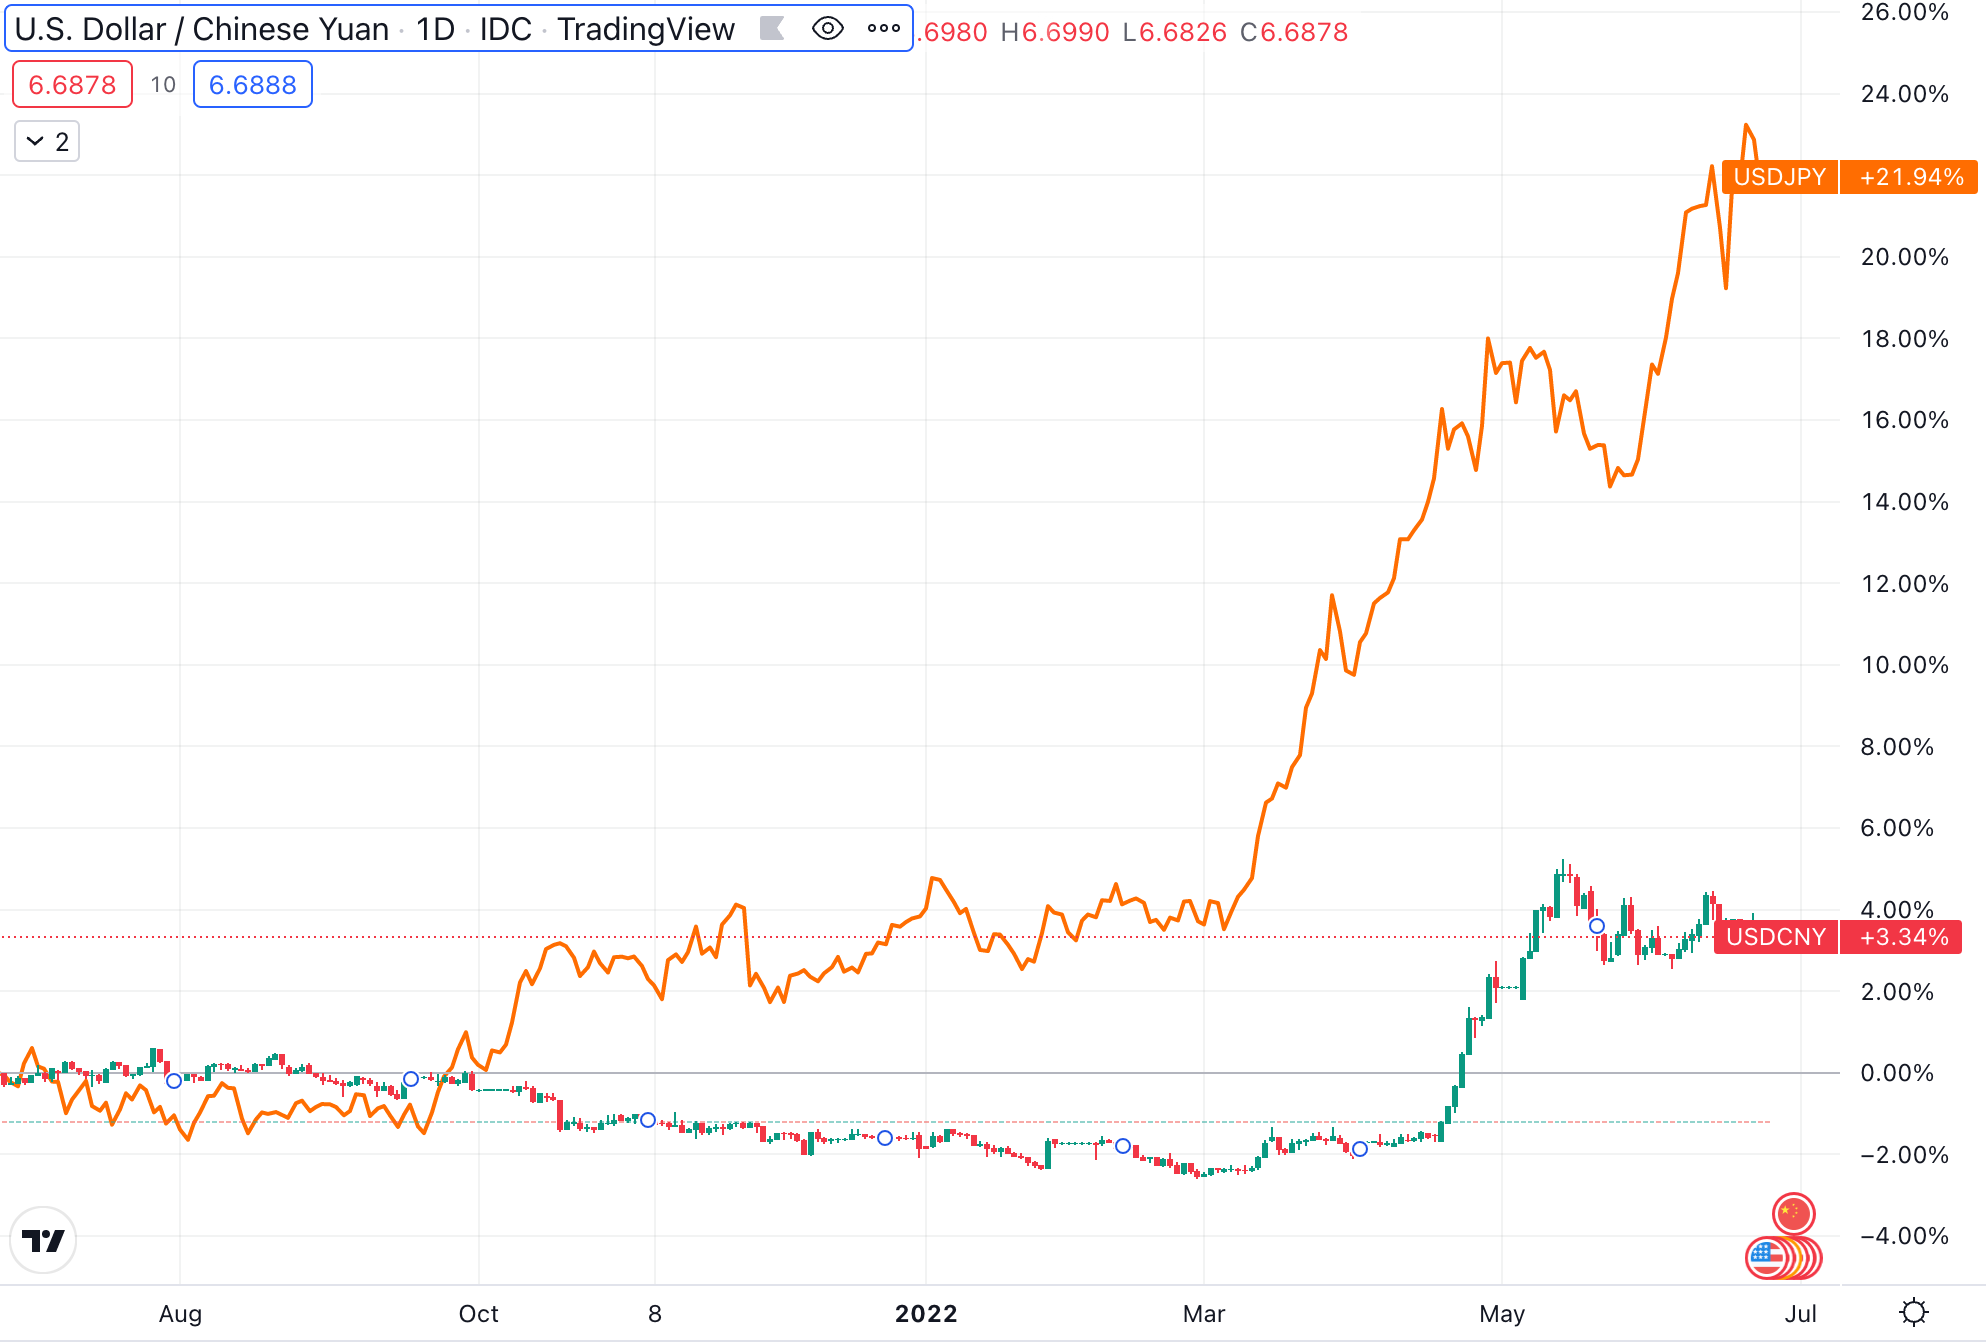
One effect of these movements is that Japan's competitiveness is increasing vis-a-vis China. That is raising fears that China's central bank (PBC) might be tempted into competitive devaluation, which in turn is raising fears of a possible re-run of the late-90s Asian financial crisis. There are some good reasons that might prevent China from taking such action – inflation would worsen considerably; currency stability and predictability would be undermined, which could damage investor confidence in the country; etc. But the chances of such a competitive devaluation are now non-negligible. If that happens, the dollar denominated bonds held by China's real estate sector would grow in burden, which might increase the chances of default and a negative outcome for Gramercy.
Second, geopolitical risk. As tensions rise between the US and China, and as the effects of the Russia-Ukraine war and related sanctions solidify, trade and regulatory battles become increasingly common and more heated. We see this in the fight over de-listing Chinese companies from US exchanges, the decision to ban Huawei from certain sectors and activities in the US, potential action against Tesla in the face of perceived surveillance concerns by Tesla and Starlink's involvement in the Russia-Ukraine war, and so on. Major de-coupling isn't likely in the near or medium terms given the deep web of connections between the two countries, but increasing risk is evident in the multiplication of battles. Real estate could be a new front in that conflict, particularly when we consider its critical importance to financial stability and economic growth (more on that below).
Third, regulatory risk. In all economies, housing and real estate are a central pillar of financial stability and household wealth, but this is even more so the case in China today. In the face of the growing crisis among property developers, Chinese authorities have already stepped in, committing to prioritizing the completion of hundreds of Evergrande's residential developments over the repayment of its approximately $20B of offshore dollar-denominated bonds. The property slump is now seen to be a bigger drag on the country's economy than its ongoing COVID lockdowns which have crippled supply chains and dampened domestic consumption. Authorities have pressured banks to increase lending in order to jumpstart the real estate sector, but to little effect, leading some to worry that borrowing standards could be forced lower, which would inject major new risks into the financial system. The gathering storm makes it increasingly likely that the government will intervene to stabilize the sector. Yet considerable uncertainty persists about what exactly it would do and what the impacts would be for investors in debt. That heightens regulatory risk.
Taken together, risks in these three areas tilt the tables against Gramercy's position.
Household debt levels pose big risks for Canada's housing market and economy compared to US
Some key differences in the US and Canadian housing markets mean the impacts of rising rates will hit households north of the border harder, raising questions about wider financial stability.
First, Canadian households have turned to variable rate mortgages at a much higher rate than those south of the border. The first graph below shows that the value of banks' new variable rate mortgages rose to more than half of all new home loans in July 2021.

By contrast, as the graph below shows, adjustable rate mortgages account for only 10.8% of overall home loan applications in the US today.
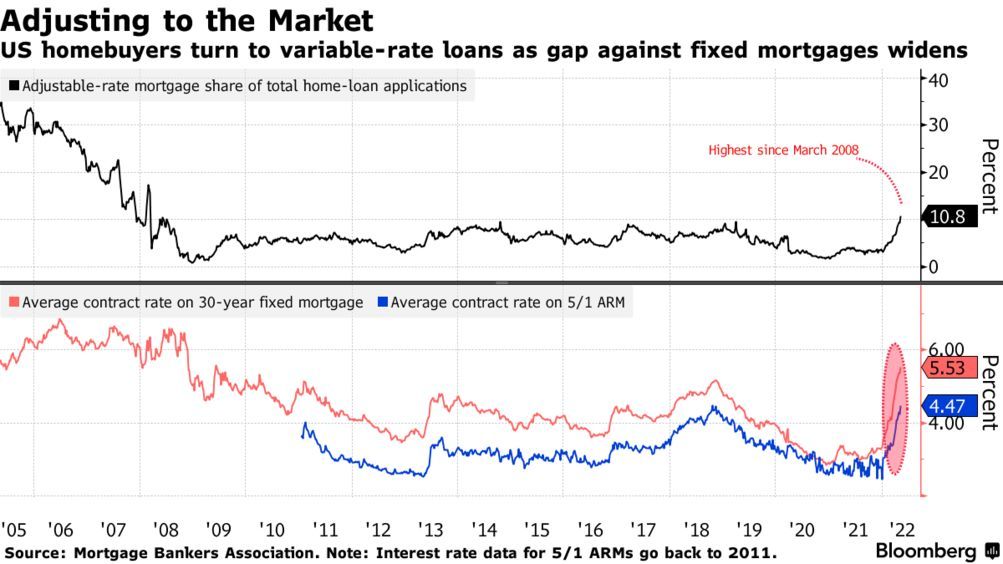
New mortgage-acquiring households are enticed to switch to variable rate plans given the widening gap against fixed mortgage plans (see bottom panel of visual above). Yet the shift to variable rate plans means households face growing interest rate risk. In an environment where rates are rising quickly and by dramatic leaps, that poses a potentially serious risk for households and the overall economy. In Canada that risk is now larger than in the US.
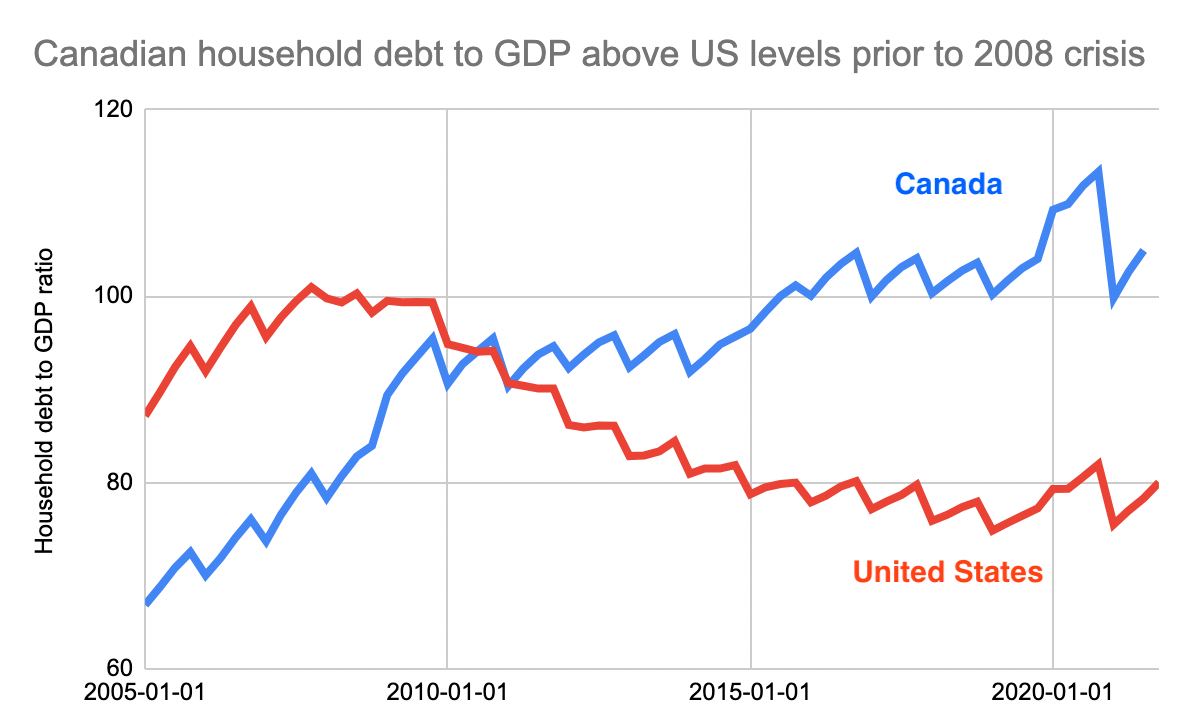
Second, the ratio of household debt to GDP has grown significantly in Canada over the past two decades, while it has come down by an equally impressive amount in the US over that period. The graph below compares the trend in the two countries. Note that levels in Canada are now above those that the US faced in the 2008 financial crisis. That means any threat to household finances has a higher chance of turning into a systemic problem in Canada than in the US today.
Third, partly as a result of the much higher household debt to GDP ratio in Canada, Canadian households face much higher debt service ratios than do American households (see graph below). That means that a much higher fraction of their disposable income goes to servicing their debt than is the case for households south of the border.

This is particularly significant in a context of economic slowdown, where unemployment is projected to rise, real wages are likely to stagnate, and a reprieve on food and energy inflation doesn't seem likely in the near term due to supply shocks. Household disposable income is under threat in both countries, yet the significant difference in the debt service ratio on both sides of the border means that Canadian households will feel greater pain.
Taken together, these differences in the housing market and household debt burdens mean that Canada's housing market and economy face particularly big risks in today's turmoil.