Will quantitative tightening spur mortgage rate hikes? The erosion of duration risk muddies the water

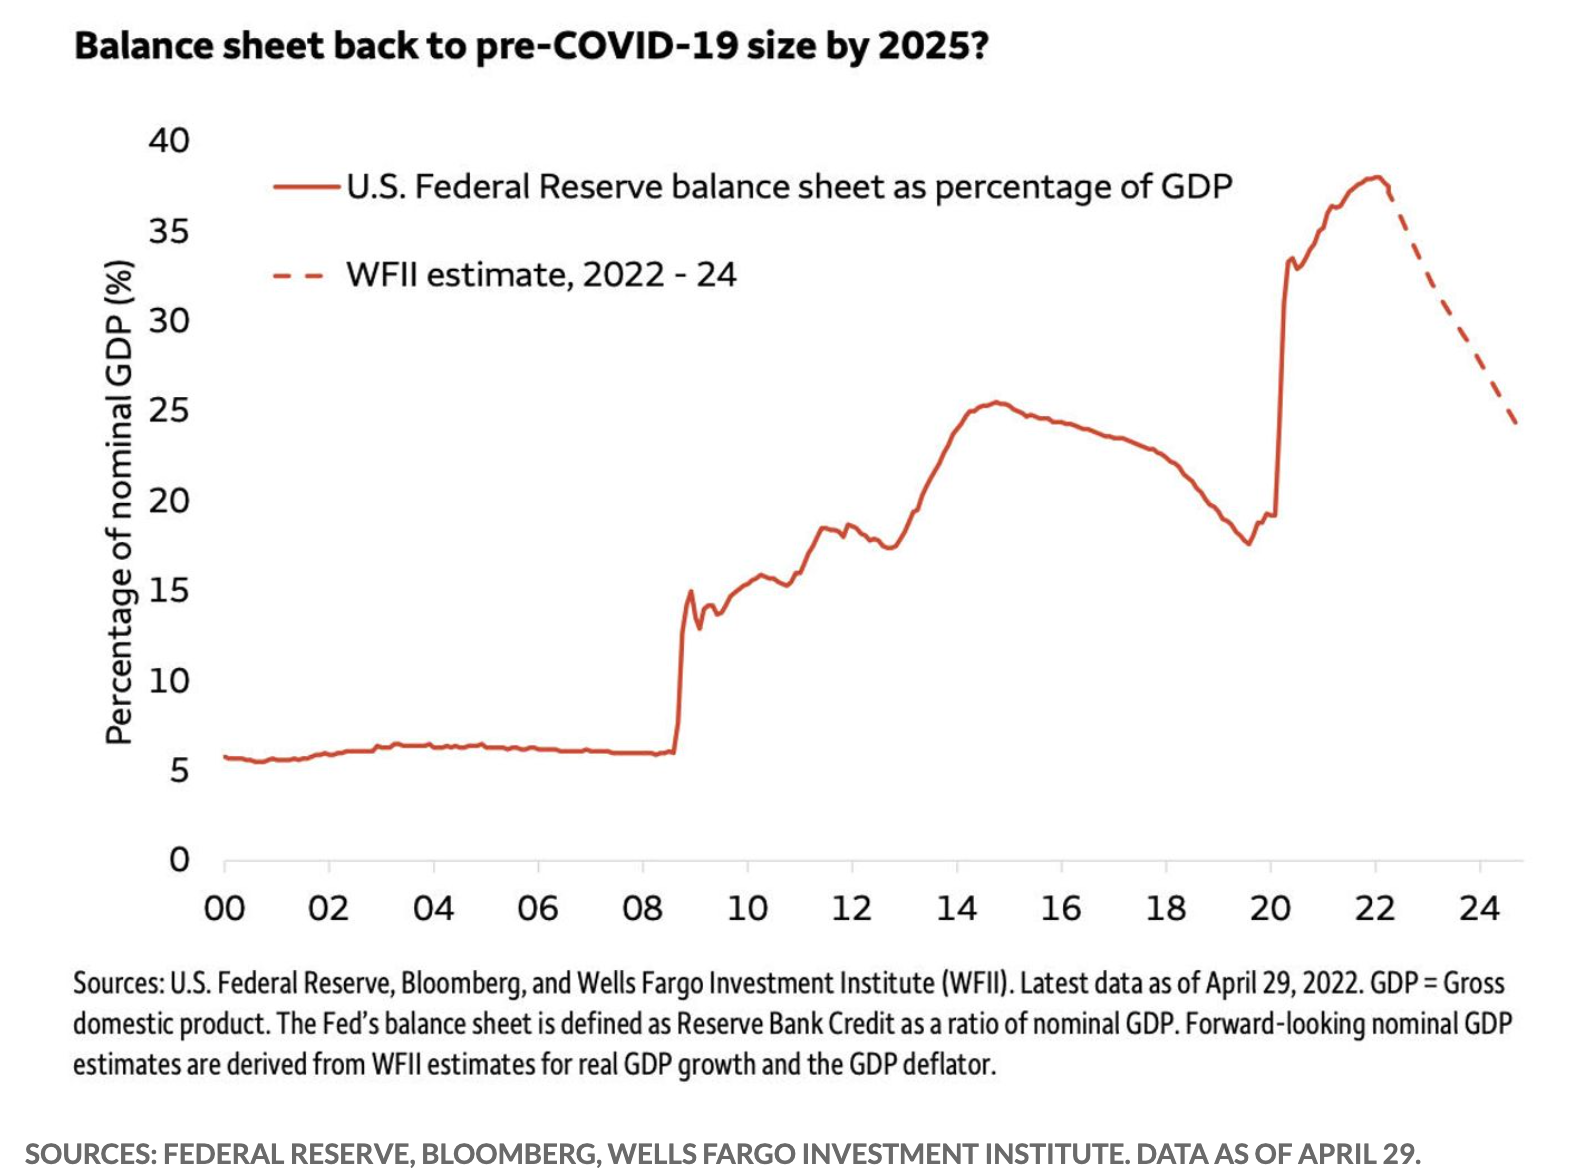
The Fed's quantitative tightening (QT) effort started at the beginning of June. It will aim to offload a substantial portion of the $9T balance sheet it has built up over the last 10+ years, in particular since the beginning of the pandemic. A good chunk of that balance sheet is in mortgage-backed securities (MBS). As it offloads MBS, what impact will it have on the housing market?
As the graph below depicts, the Fed has about $2.7T worth of MBS on its balance sheet today. Close to half of that was built up in the last two years as part of its larger quantitative easing (QE) purchase program. That created an abnormal effect in the mortgage market. Reversing it through QT might create even bigger ripples.

We're about to see an unwinding of the Fed's balance sheet at a scale and pace we've never seen before. For comparison, the last time the Fed executed a round of QT (2017-19), balance sheet tightening started much later in the Fed's overall tightening schedule and proceeded at a pace much slower than what is planned for this current round of QT. Then, the Fed waited almost two years after hiking interest rates for the first time after the financial crisis in December 2015 before starting to offload bonds from its balance sheet. This time around, the Fed only waited three months.
Furthermore, when the Fed did start to offload bonds as part of its 2017-19 QT program, it did so gradually and up to a more limited peak, increasing the offload volume slowly until it hit $50B a month. This time around, the Fed plans to ramp up offloads dramatically faster to a monthly cap of $95B, nearly twice the previous volume cap. When Janet Yellen was Fed Chair during the previous round of QT, she likened its effects to watching paint dry. But this round of QT might be different.

When it comes to reducing MBS holdings on its balance sheet, the Fed has a few options. MBS can obviously be sold to another buyer, but they can also disappear from the balance sheet when mortgages are paid off by the borrower. Often, this occurs when a mortgage loan comes to full term and is fully paid off. But it can also happen when a borrower decides to pay the loan off early, as happens when a re-financing event occurs, when a borrower decides to sell the property before the mortgage is fully paid off, etc. Of course, there's nothing new about mortgages disappearing off the edge of the Fed's balance sheet in this way. What will be new is the Fed's decision to not replace them with new MBS in order to maintain or increase the level of MBS holdings. It will passively allow attrition to draw down its holdings.
However, the speed and scale of the Fed's QT plans mean that it can't rely on this pathway alone to reduce MBS holdings. This is because the other half of the Fed's tightening policy – rate hikes – actually slows the speed at which mortgages will disappear off the Fed's balance sheet on their own. As the Fed raises the interest rate to be paid on reserve balances, mortgage rates rise as well. When mortgage rates rise, homeowners with an active mortgage are less likely to want to refinance their mortgage. During the years of extremely low interest rates, mortgage holders refinanced their mortgages at extremely high rates (see graph below) to lock in better and better deals. When a mortgage is refinanced, the original mortgage is fully paid off earlier than the full term of the mortgage loan. In aggregate, a high refinancing rate means the average mortgage duration is low, which results in mortgages spilling off the Fed's balance sheet at a faster pace. By contrast, as rates rise, it makes much less sense for households to refinance, which slows the pace of roll-off.

In November 2021, when rates were still very low, the conditional mortgage prepayment rate was about 30%, but Jefferies chief economist Aneta Markowska noted that it was likely to drop to 10% very soon, just as it did at the peak of the previous round of QT in 2017-19. Such a drop would mean that MBS runoff will only average about $20B per month, well below the $35B per month that the Fed has set as its target for the current round of QT. That means it will need to sell close to $15B of MBS per month to meet its target.
The question on a lot of people's minds right now is how the Fed's sale of this much MBS will impact mortgage rates. Typically, a large injection of supply would cause price to dive, which in the case of mortgages would imply rate increases. But there's reason to believe that won't actually happen, at least in the near term. To understand why, we need to consider how MBS differs from similar asset classes in the fixed income space.
One of the major risks faced by investors in corporate bonds is that the company will go belly-up. We refer to that as 'credit risk'. By contrast, most MBS is backed by a government guarantee of some sort. But MBS does face a form of risk not faced by corporate bonds – that risk of borrower pre-payment that I talked about above. We refer to that as 'pre-payment risk' or 'duration risk'. For their part, Treasuries (at least in a very secure setting like the US) lack both credit risk and duration risk. It's for this reason that yields on Treasuries are typically lower than those of both MBS and corporate bonds. But the open question is whether or not the current gap separating yields for these asset classes maps well onto the current gap separating risks of those asset classes.
Recall that duration risk for MBS is declining significantly as mortgage holders refinance much less often in a rising rate environment. That means that MBS risk is approaching that of Treasuries, especially given the low risk of default given healthy household balance sheets and a still-roaring labor market coming out of the pandemic.
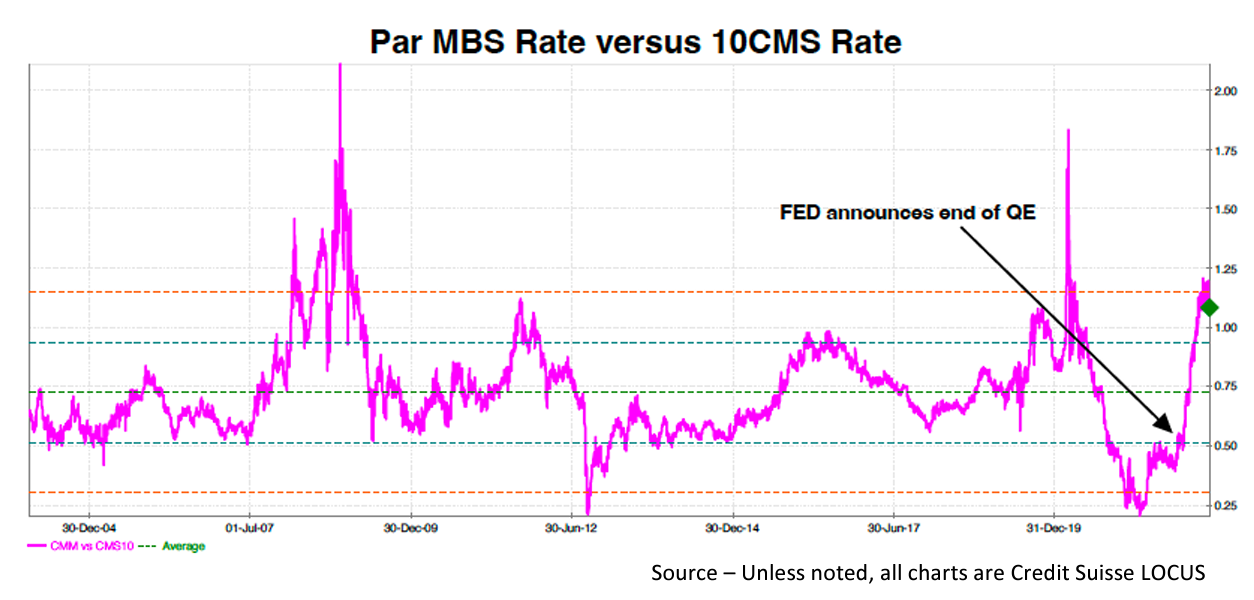
Yet, as a recent analysis by Harley Bassman at Simplify Asset Management shows, the gap in yields doesn't yet reflect that convergence of risk. He writes: "To create an apple to apples construction, Wall Street will consider the yield of a synthetic MBS bond always priced at 100, known as a Constant Maturity Mortgage (CMM), and compare this to the constant ten-year interest rate (CMS). I consider this spread to be the best macro indicator of MBS value; and at a recent spread of 115bp it is nearly two standard deviations above its long-term average of 73bps." We see this ratio graphed below – pink line is the ratio; dotted green line is the long-term average; orange dotted lines represent 2 SDs from that mean.

So as it stands today, MBS represents an under-exploited investment opportunity. And Bassman recommends investors lean into that opportunity by buying into an ETF with direct MBS exposure, like the iShares MBB ETF. That ETF is down year-to-date, but less than the overall market – about -8% compared to -16% for the S&P 500. And moreover Bassman is convinced that a correction is in the offing once investors realize the opportunity offered by MBS at the current price.
If Bassman is right, and if he's effective in convincing the market of his take, investor demand for MBS will moderate the effect of massive new MBS supply being dumped into the market by the Fed's QT effort. For now, that should have the effect of blunting any upward pressure on mortgage rates due purely to QT.
But what happens once that correction has occurred yet the hum of QT continues? The sheer size of the Fed's balance sheet today means that, even with a faster QT run-down that starts earlier in the tightening cycle and ramps up faster, it will take some time for the Fed to get to its desired level of holdings. By contrast, the gap pointed to by Bassman is likely to converge much faster. There's a lot of uncertainty on how all of this will play out in the coming months and years, but right now it seems likely that QT will, in the medium-term, pile upwards pressure on mortgage rates.